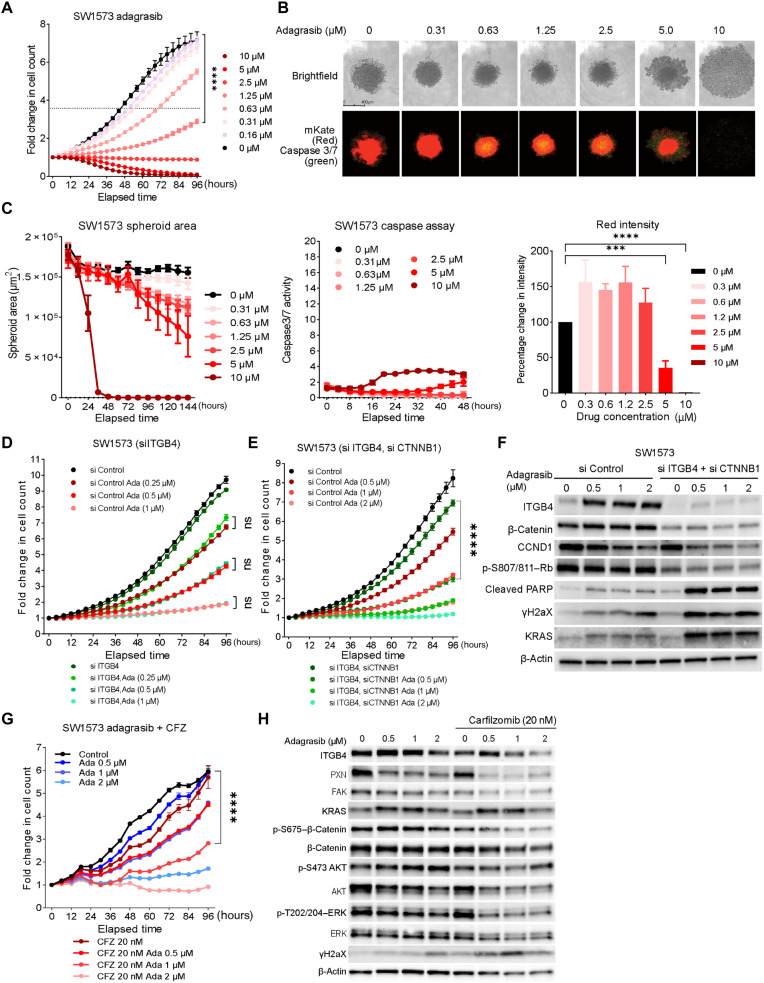
Fig. 4. Adagrasib is effective in inhibiting sotorasib-resistant NSCLC cells.
(A) Fold change in SW1573 cells growth with increasing concentration of adagrasib (0.6 to 10 μM). The dotted line represents a fold change in cell count, which corresponds to half of the total fold change shown by control cells. Statistical significance was calculated using two-way ANOVA for each time point and drug concentration. n = 3 per group; ****P < 0.0001. (B) IncuCyte images of SW1573 spheroids on day 5 of adagrasib (0.31 to 10 μM) treatment. (C) Changes in the spheroid area, caspase 3/7 activity, and red intensity. 10 μM adagrasib disintegrated the SW1573 spheroid and increased caspase 3/7 activity by threefold. Statistical significance was calculated using two-way ANOVA. n = 3 per group. (D) Live cell proliferation assay of ITGB4 siRNA-transfected SW1573 cells with and without adagrasib treatment for 96 hours. Two-way ANOVA was used to calculate the statistical significance (si Control or si ITGB4; n = 3 per group; ****P < 0.0001). (E) Effect of ITGB4/CTNNB1 double knockdown on SW1573 cells proliferation with and without adagrasib treatment for 96 hours (si Control, si ITGB4, Si CTNNB1, si CTNNB1 + si ITGB4; n = 3 per group; two-way ANOVA test, ****P < 0.0001). (F) ITGB4/CTNNB1double knockdown and adagrasib treatment induced expression of cleaved PARP, γH2AX expression, and inhibited Rb phosphorylation. (G) Inhibitory effect of adagrasib (0.5 to 2 μM) and CFZ (20 nM) on the SW1573 cell proliferation was additive. n = 3 per group. Two-way ANOVA test, ****P < 0.0001. (H) Immunoblot analysis of the signaling changes induced by adagrasib and CFZ combination. The combination treatment inhibited the expression of activated AKT, ERK, and β-catenin required for drug resistance.

