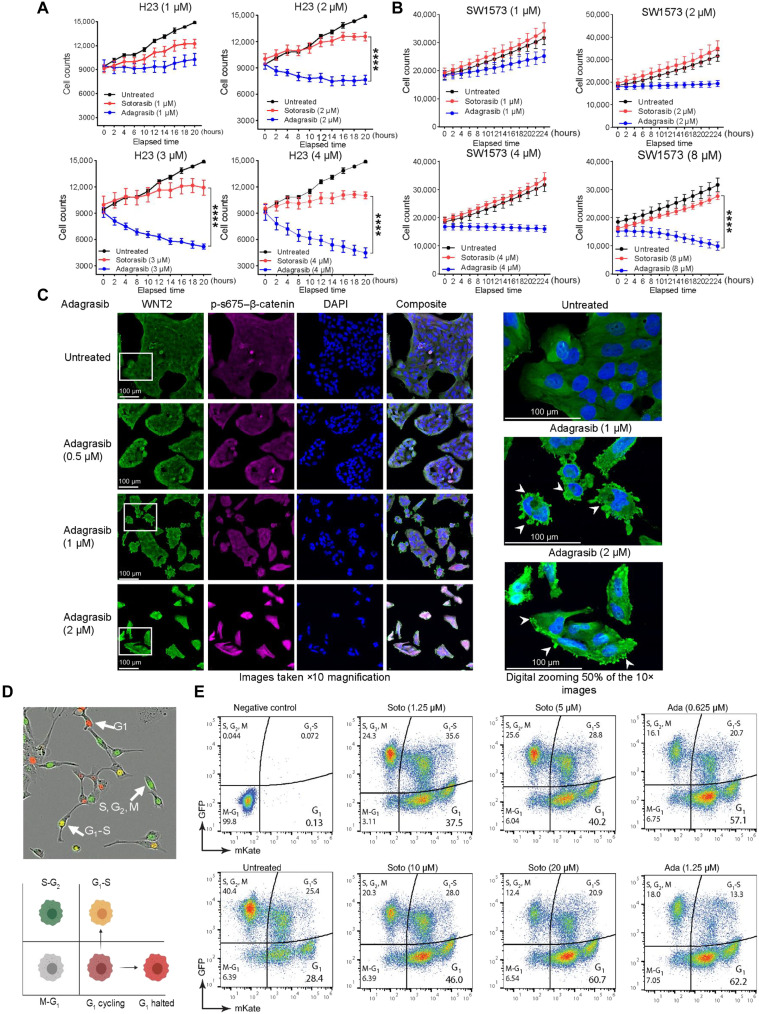
Fig. 5. KRAS G12C inhibitors have a differential effect on cell growth and progression.
(A) Effect of increasing concentrations (1 to 4 μM) of sotorasib and adagrasib exhibited different effects on cell proliferation over 24 hours in H23 cells. Two-way ANOVA was used for calculating statistical significance across various time points and for each drug concentration. n = 3. (B) Effect of KRAS inhibitors sotorasib or adagrasib increasing concentrations (1 to 8 μM) on SW1573 cells within 24 hours of drug treatment. Two-way ANOVA test was used to calculate the statistical significance. n = 3 sample per group. (C) Immunofluorescence image of SW1573 to support the dose dependent inhibitory effect of adagrasib on cell growth and expression of WNT2 (green) and phospsho-S675–β-catenin (magenta). The region of interest was zoomed 50% digitally to show membrane blebbing induced by adagrasib (white arrows). (D and E) Cell cycle dynamics were determined using IncuCyte Cell Cycle Lentivirus Reagent with fluorescence indicating cell cycle phase (brightfield image and schematic). Effect of increasing concentrations of sotorasib (1.25 to 20 μM) and adagrasib (0.6 to 1.25 μM) on cell cycle in SW1573 cells represented as pseudo color plots. The y axis of the plot represents events positive for GFP, and x axis represents the events positive for mKate2. mKate positive represents G1; GFP positive represents S, G2, and M; and double positive represents G1-S–transitioning cells.

