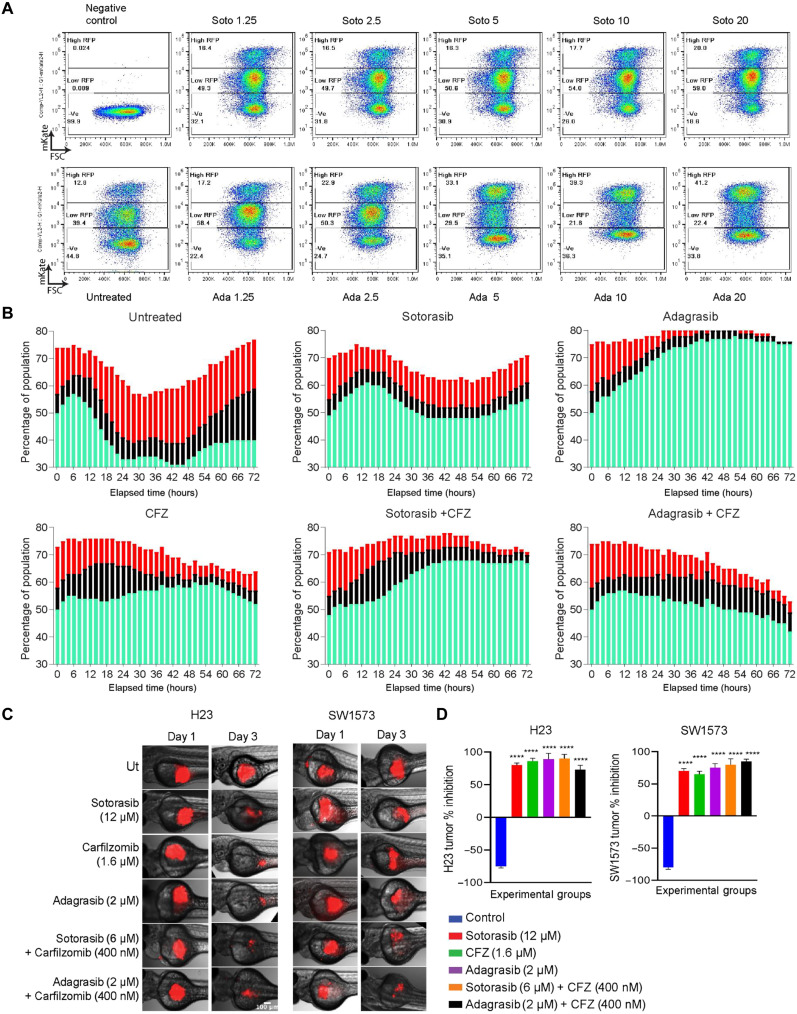
Fig. 6. KRAS G12C inhibitors have a differential effect on the cell cycle.
(A) Pseudo color plot representing the changes in the percentages of the G1 cell population with respect to drug treatment. The cells expressing low RFP (G1 cycling) and high RFP (G1 halted) are gated and analyzed for the increasing concentration of sotorasib (top row) and adagrasib (bottom row). The y axis of the plot represents events positive for mKate2, and x axis represents the forward scatter (FSC). (B) Cell cycle kinetics of the SW1573 cells was followed using the live cell imaging assay after drug treatment 10 μM sotorasib IC50 concentration, 10 μM adagrasib, 20 nM CFZ, sotorasib or adagrasib, and CFZ combination. Sotorasib and CFZ induced strong G1 arrest as done by adagrasib alone. The green bar represents G1 percent of the total population, the black bar represents S percent of the total population, and the red bar represents G2-M percent of the total population. (C) Red fluorescence dye–labeled H23 (left) and SW1573 (right) cells were xenotransplanted in zebrafish larvae, and images were taken after 3 days of 12 μM sotorasib, 2 μM adagrasib, 1.6 μM CFZ, 6 μM sotorasib + 0.4 μM CFZ, or 2 μM adagrasib + 0.4 μM CFZ treatment. (D) Percentage change in tumor growths was represented as bar graph against the experimental groups. The combination was effective at less concentration of the drugs. Statistical significance was calculated using one-way ANOVA. n = 10. ****P < 0.0001.

