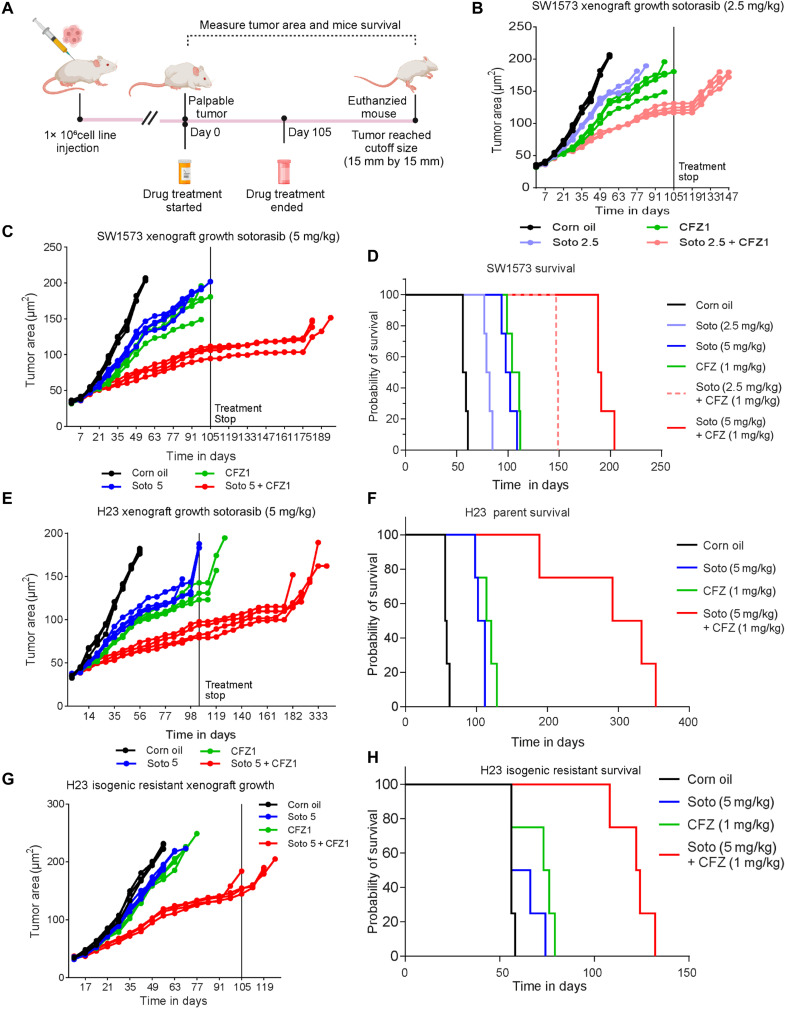
Fig. 7. In vivo models confirm the sensitivity of cells to KRAS G12C inhibitors and CFZ combination treatment.
Mice xenografts were created using SW1573 cells to determine the antitumor effects of sotorasib, adagrasib, and CFZ and their combinations in vivo. (A) Schematic of in vivo study. (B and C) Changes in the tumor area changes (mm2) of xenografts with respect to sotorasib (2.5 or 5 mg/kg) or CFZ (1 mg/kg) single treatments and drug combination treatments [sotorasib (2.5 mg/kg) + CFZ (1 or 5 mg/kg) + CFZ (1 mg/kg)]. Statistical significance was calculated using one-way ANOVA. n = 5. ****P < 0.0001. (D) Survival probability of the mice harboring SW1573 cell line–derived xenografts. The combination treatment of sotorasib (2.5 mg/kg) + CFZ (1 or 5 mg/kg) + CFZ (1 mg/kg) has the highest median survival compared to single treatments. (E and F) Changes in the tumor area (mm2) of H23 cell line–derived xenografts with respect to sotorasib (5 mg/kg) or CFZ (1 mg/kg) single treatments or combination treatments [sotorasib (5 mg/kg) + CFZ (1 mg/kg)]. Survival probability of the mice harboring H23 cell line–derived xenografts. Statistical significance was calculated using one-way ANOVA. n = 5. ****P < 0.0001. (G and H). Changes in the tumor area (mm2) of H23 isogenic resistant cell line–derived xenografts and survival. The combination treatment of sotorasib (5 mg/kg) + CFZ (1 mg/kg) has the highest median survival compared to the single drug. Statistical significance was calculated using one-way ANOVA. n = 5. ****P < 0.0001.

