Figure 3.

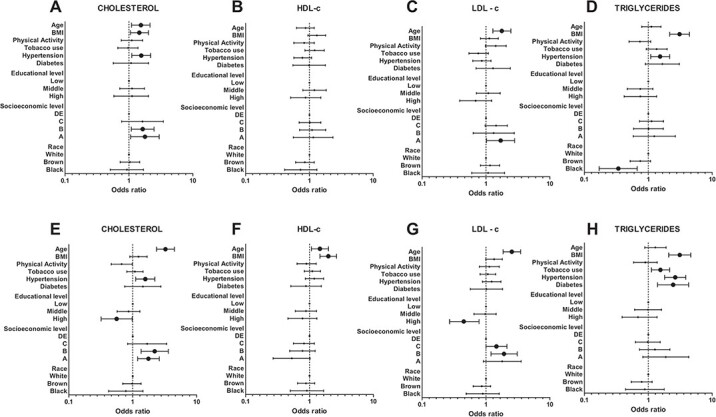
Logistic regression for the association between categorized lipid profile and risk factors in (A–D) men and (E–H) women. Significant associations are highlighted with bigger symbols. Data represent adjusted OR and 95% CI.

Logistic regression for the association between categorized lipid profile and risk factors in (A–D) men and (E–H) women. Significant associations are highlighted with bigger symbols. Data represent adjusted OR and 95% CI.