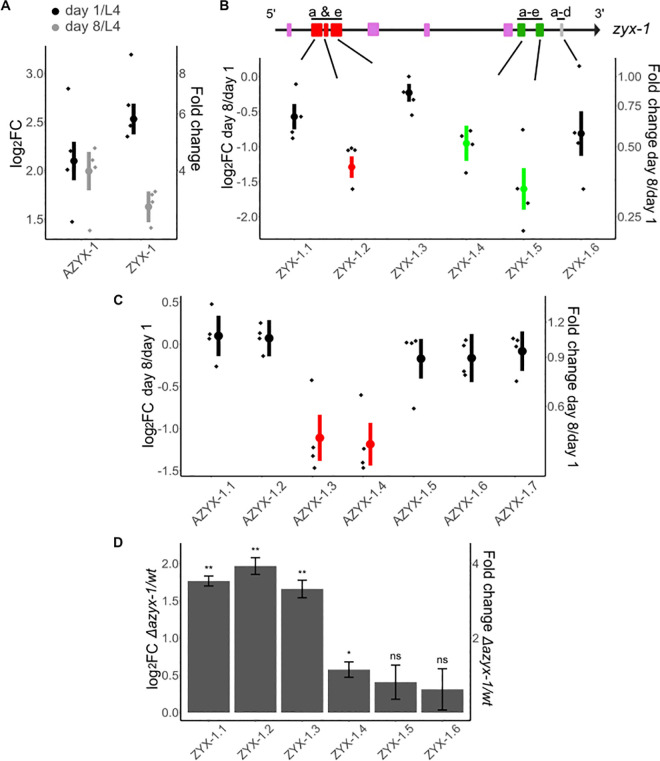
Fig 3. Targeted quantitation in aging worms and in an azyx-1a deletion mutant reveals age-dependent zyx-1 fold change and cis regulation by azyx-1.
Graph axes indicate log2 fold change (left) and absolute fold change (right). Data normalized to a spike-in peptide (1 fmol/worm) for aging wt worms and GPD-3 for mutant vs. wt comparison, with 4 biological replicates (diamonds) for each time point, mean (circle), and standard error bars. (A) Fold change at day 1 (black) and day 8 (gray) of adulthood in comparison to L4 larval stage for all quantified peptides of AZYX-1 (7 peptides) and ZYX-1 (6 peptides) combined. (B) Fold change at day 8 in comparison to day 1 of adulthood for individual ZYX-1 peptides (1.1 to 1.6). zyx-1 gene model indicates the location of peptides unique to long isoform a and e (1.1–1.3) and peptides shared by longer and shorter isoforms (1.4–1.6). (C) Fold change at day 8 in comparison to day 1 of adulthood for individual AZYX-1 peptides (1.1 to 1.7). AZYX-1.1 and 1.2 are unique to AZYX-1a while the rest are shared by AZYX-1a and AZYX-1b. Significantly decreased peptides are colored as per their position relative to the overlapping zyxin gene model (red: long, green: shared; fold change cut-off = <0.66, p-value = <0.02). (D) Peptides unique to ZYX-1 long isoforms (ZYX-1.1–1.3) show a consistent increase in the azyx-1 deletion mutant, while peptides shared between all ZYX-1 (1.4–1.6) isoforms remain similar to wild-type levels (at day 1 of adulthood); p-value: * <0.05, ** <0.01, *** <0.001, ns = not significant, n = 4 biological replicates, with data normalized to GPD-3. For spike-in and HIS-24 normalization, see S3A and S3B Fig. Data used to generate figures can be found in S1 Data.

