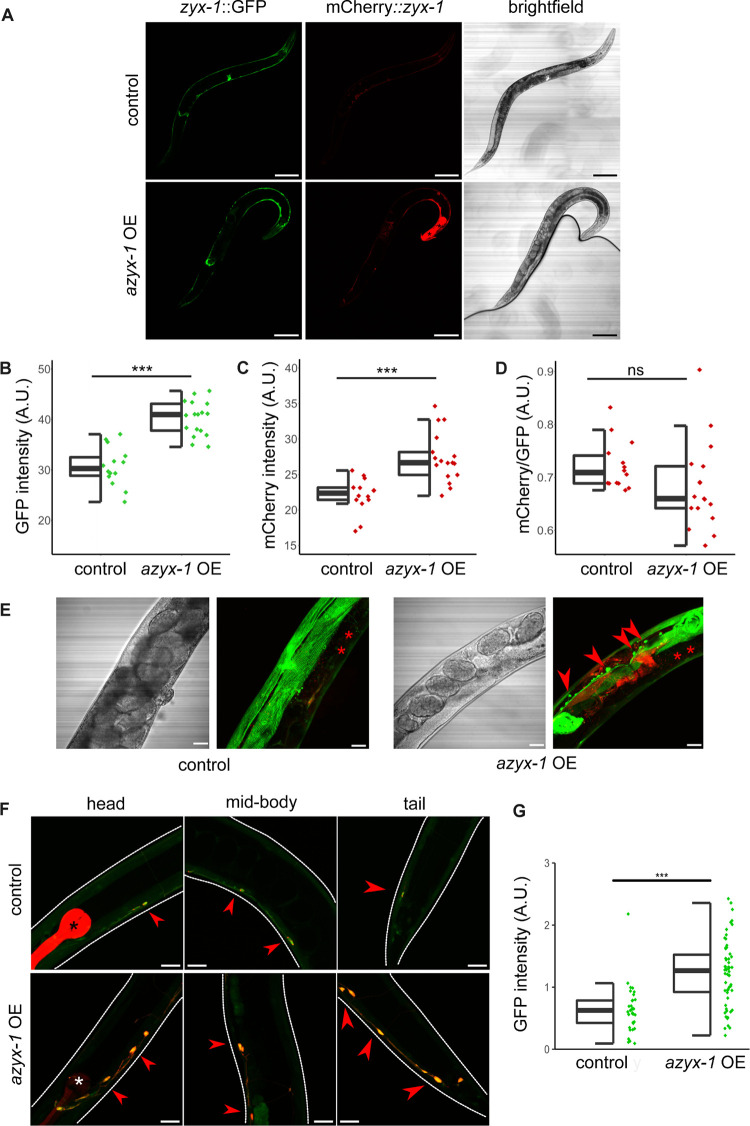
Fig 4. azyx-1 overexpression increases zyxin reporter signal and leads to zyxin accumulation in motor neurons.
(A) The integrated reporter control (LSC1870) (upper) contains ZYX-1::GFP (representing all isoforms) and mCherry::ZYX-1 (representing long isoforms), which is compared against a strain with the same genetic reporter background (lower), extrachromosomally overexpressing azyx-1 (azyx-1OE, LSC1960). Anterior to the right; scale bar, 100 μm. (B) GFP (p = 4.85 × 10⁻⁸) and (C) mCherry (p = 4.82 × 10⁻⁵) quantification showing increase in signal upon azyx-1 overexpression, with * indicating significance (ANOVA) for n ≥ 14 per condition. (D) Ratio of mCherry/GFP. (E) Increased accumulation of GFP along the ventral nerve cord as observed in azyx-1OE (LSC1960) compared to control reporter (LSC1870), *intestinal autofluorescence and (F) colocalization (merged mCherry and GFP, red arrows) of zyx-1::GFP in motor neurons upon azyx-1 overexpression as imaged in adult head, mid-body, and tail. Upper panels: control worms (LSC1998) only expressing the neuronal reporter construct (unc-47p::mCherry) and *co-injection marker (myo-2p::mCherry), lower panels: azyx-1 OE (LSC1999) in the control background. Scale bars: 20 μm. (G) GFP quantification in unc-47p::mCherry-positive cells showing increase in signal upon azyx-1 overexpression (Welch’s t test p = 2.25 × 10⁻¹¹, n ≥ 35 neurons per condition). Data used to generate figures can be found in S1 Data.

