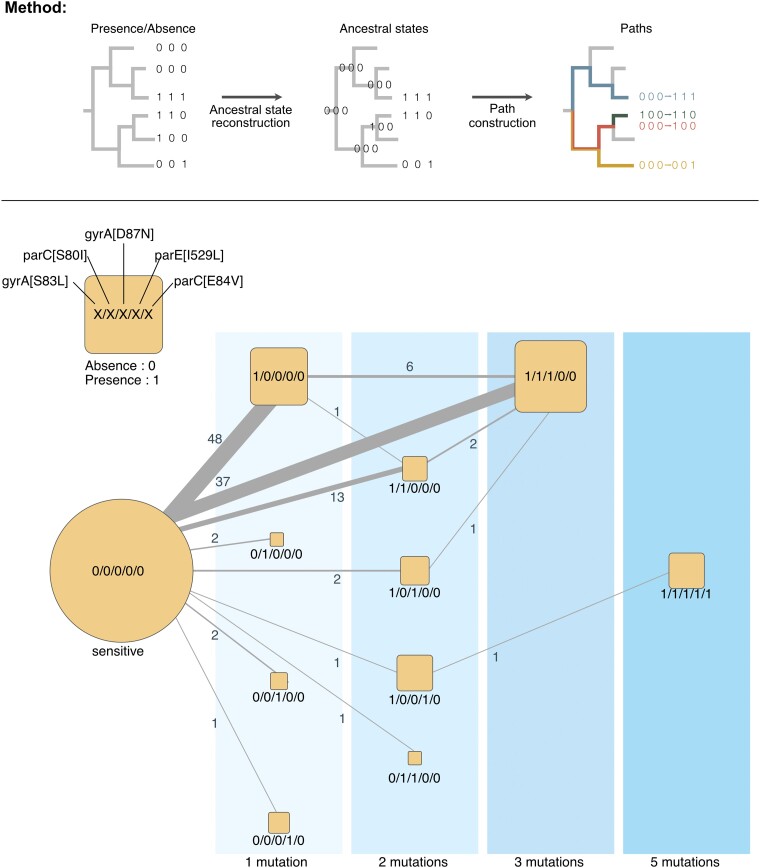
Fig. 3.
Chronologies of acquisition of the main resistance mutations in E. coli of the RefSeq dataset. Graphical representation of the method: Starting from the phylogenetic tree and the presence/absence matrix of the mutation conferring the resistance to quinolone, we inferred the ancestral state of each mutation at every node. These states were used to reconstruct the chronologies of acquisition of the mutation conferring resistance to quinolone. Reversions were very rare (<1% of all transitions) and were not plotted for clarity. The chronologies identified in this figure represent successions of events in the tree and thus account explicitly for the population structure. The vertical areas represent the number of distinct mutations in genomes. The size of the square scales with the number of genomes observed (leaves of the tree). The edges represent the chronologies of acquisition of one or several mutations as inferred from the reconstruction of ancestral states on the tree. The edge size is proportional to the frequency of the respective transition, with the labels showing this exact number.

