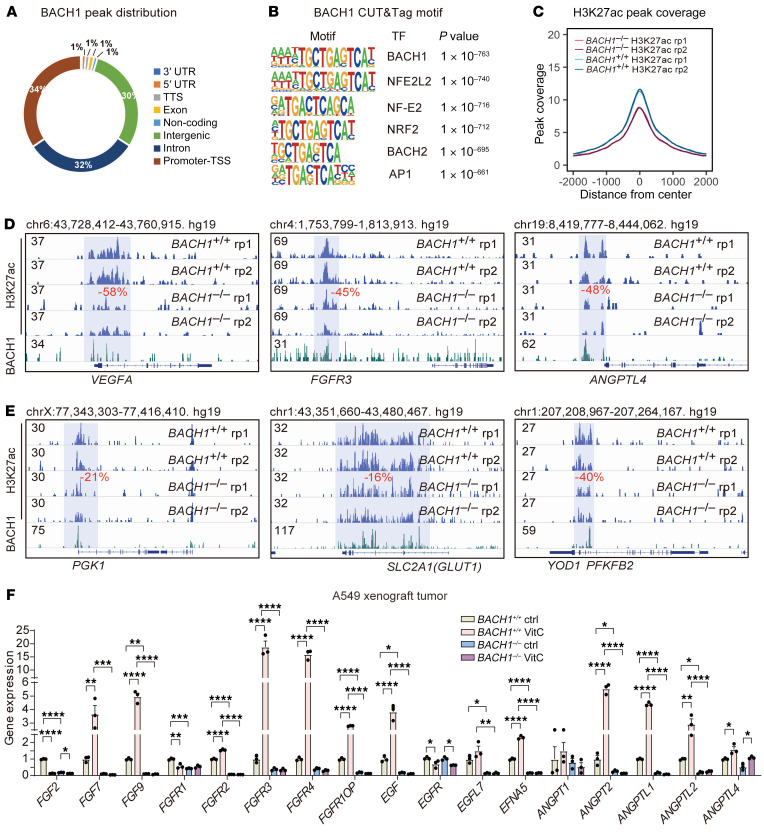
Figure 3. BACH1-mediated expression of angiogenesis and glycolysis genes correlates with BACH1-dependent epigenetic changes at promoter regions.
(A) Genome-wide profiling of BACH1 chromatin enrichment in A549 spheroids using CUT&Tag. (B) Transcription factor DNA-binding motif analysis of BACH1 CUT&Tag peaks. (C) Genome-wide plot of H3K27ac peak density in BACH1+/+ and BACH1–/– A549 spheroids; note that the 2 lines for each genotype replicate (rp1/rp2) overlap. (D and E) Integrative Genomics Viewer (IGV) tracks showing H3K27ac levels at the indicated angiogenesis (D) and glycolysis (E) gene loci in BACH1+/+ and BACH1–/– A549 spheroids. BACH1 peaks are shown at the bottom to indicate overlap with H3K27ac-marked regions. Regions with significant H3K27ac changes in BACH1–/– compared with BACH1+/+ A549 spheroids are highlighted in blue; the percentage of change is indicated in red. (F) RT-qPCR of the expression of a broader set of angiogenesis-related genes in tumors from mice engrafted with BACH1+/+ and BACH1–/– A549 lung cancer cells. The mice were given VitC (3.47 g/L) or normal drinking water for 7 weeks (n = 3 experiments). Data indicate the mean ± SEM. *P < 0.05, **P < 0.01, ***P < 0.005, and ****P < 0.001, by 1-way ANOVA with Tukey’s post hoc test for multiple comparisons (F).

