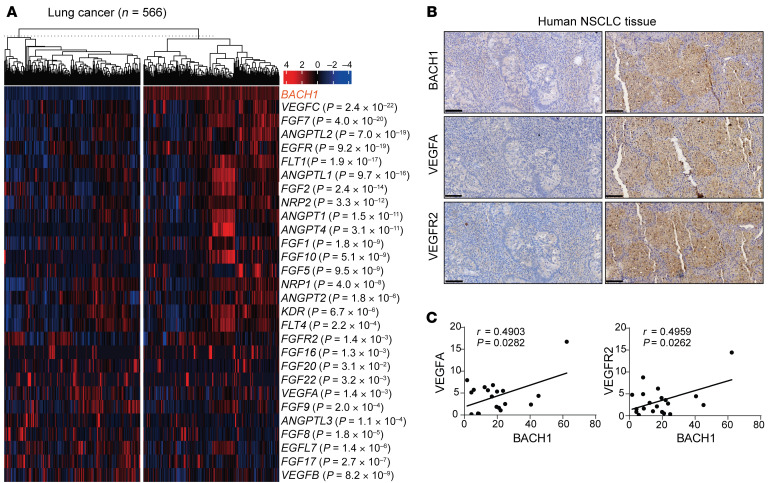
Figure 6. BACH1 expression correlates with angiogenesis gene and protein expression in human NSCLC samples.
(A) Heatmap showing TCGA lung cancer cases with low (left) and high (right) BACH1 expression. Angiogenic genes whose expression differed significantly between the 2 groups are listed on the right along with the P value for the correlation with BACH1 expression. (B) Representative immunohistochemical staining for BACH1, VEGFA, and VEGFR2 in consecutive sections of tumors from patients with KRAS-mutant NSCLC. Tumor sections with low BACH1 expression (left); tumor section with high BACH1 expression (right). Original magnification, ×20. Scale bars: 100 μm. (C) Comparisons of VEGFA and VEGFR2 expression with BACH1 protein expression in human NSCLC tumor sections (n = 20). Data were analyzed using Pearson’s correlation test (C).

