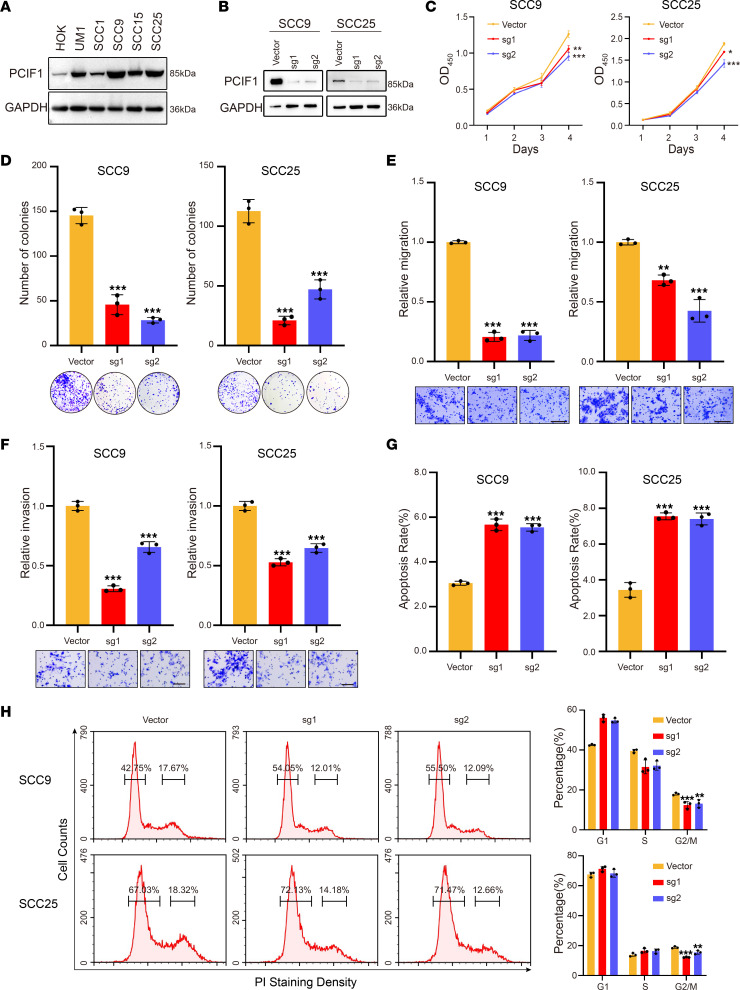
Figure 2. Knockout of PCIF1 suppresses the HNSCC malignant phenotype.
(A) Western blotting analyses of the PCIF1 expression in the cell lines. (B) Western blotting analyses detecting the PCIF1 expression in SCC9 (left) and SCC25 (right) control cells and PCIF1-KO cells. (C) Cell Counting Kit-8 (CCK8) assay of cell viability in control and PCIF1-KO cells (n = 3). *P < 0.05, **P < 0.01, ***P < 0.001 by 1-way ANOVA, Dunnett’s test. (D) Colony formation assay detecting the colony ability of control and PCIF1-KO cells (n = 3). ***P < 0.001 by 1-way ANOVA with Tukey’s multiple-comparison test. (E and F) The cell migration (E) and invasion (F) ability of control and PCIF1-KO cells was determined by Transwell assay (n = 3). **P < 0.01, ***P < 0.001 by 1-way ANOVA with Tukey’s multiple-comparison test. Scale bar: 100 μm. (G) Flow cytometry assay for cell apoptosis in control and PCIF1-KO cells. Bottom: Representative images. Top: Quantification data (n = 3). ***P < 0.001 by 1-way ANOVA with Tukey’s multiple-comparison test. (H) Cell cycle progression was detected by flow cytometric analyses in control and PCIF1-KO cells (n = 3). **P < 0.01, ***P < 0.001 by 1-way ANOVA with Tukey’s multiple-comparison test.

