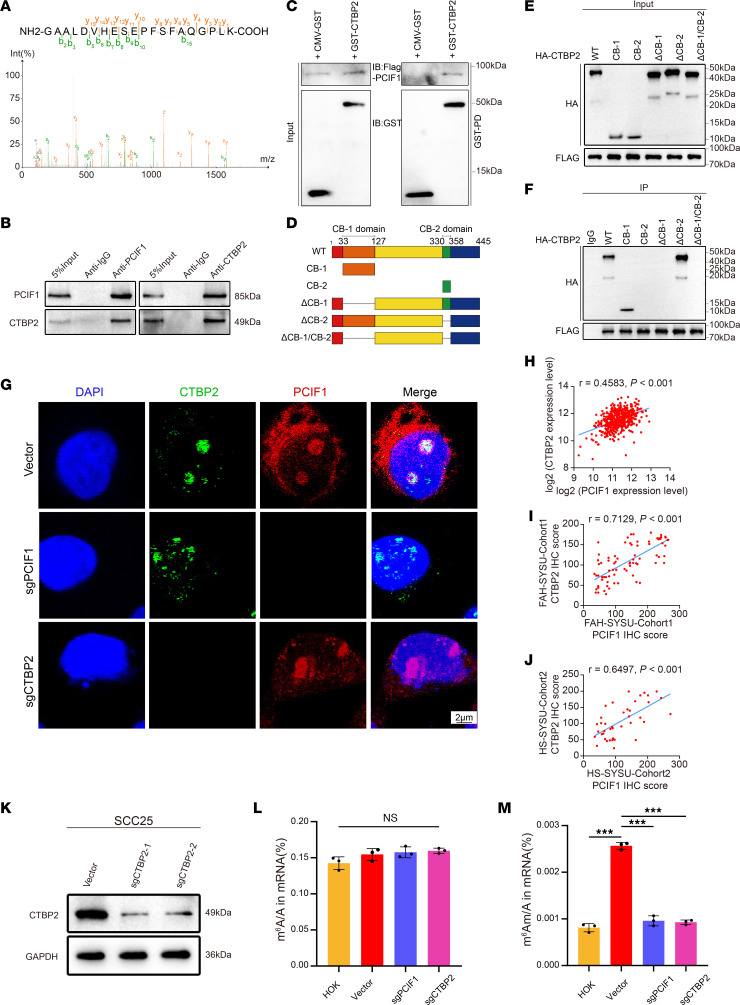
Figure 3. CTBP2 and PCIF1 interact and co-catalyze m6Am modification on mRNA.
(A) The CTBP2 peptide identified in MS analysis after coimmunoprecipitation assay. (B) Immunoprecipitation and immunoblotting analysis of the interaction between CTBP2 and PCIF1. (C) GST pull-down assay of recombinant GST-CTBP2 and FLAG-PCIF1 proteins. The coprecipitated CTBP2 and PCIF1 proteins were detected by Western blot with anti-GST and anti-FLAG antibodies. (D) Strategy of CTBP2 variant proteins for mapping interaction domains with PCIF1. (E and F) Mapping of the binding domain of CTBP2 shows the potential binding site. The lysates were immunoprecipitated with anti-FLAG antibodies, followed by immunoblotting with anti-HA and anti-FLAG antibodies. Anti-IgG antibody was used as a negative control. (G) Analysis of colocalization of CTBP2 (green) with PCIF1 (red) by double immunofluorescence staining in control cells, PCIF1-KO cells, and CTBP2-KO cells. Nuclei are stained with DAPI (blue). Scale bar: 2 μm. (H–J) Pearson’s correlation analysis showed a positive correlation between CTBP2 and PCIF1 expression according to TCGA data (H, n = 520), FAH-SYSU-Cohort1 (I, n = 57), and HS-SYSU-Cohort2 (J, n = 40). P value was calculated by Pearson’s correlation coefficient test. (K) Western blotting analyses detecting the CTBP2 expression in SCC25 control cells and CTBP2-KO cells. (L and M) LC-MS/MS quantification of the m6A/A ratio (L) and m6Am/A ratio (M) in mRNA obtained from HOK cells, control cells, PCIF1-KO cells, and CTBP2-KO cells (n = 3). P > 0.05, ***P < 0.001 by 1-way ANOVA with Tukey’s multiple-comparison test.

