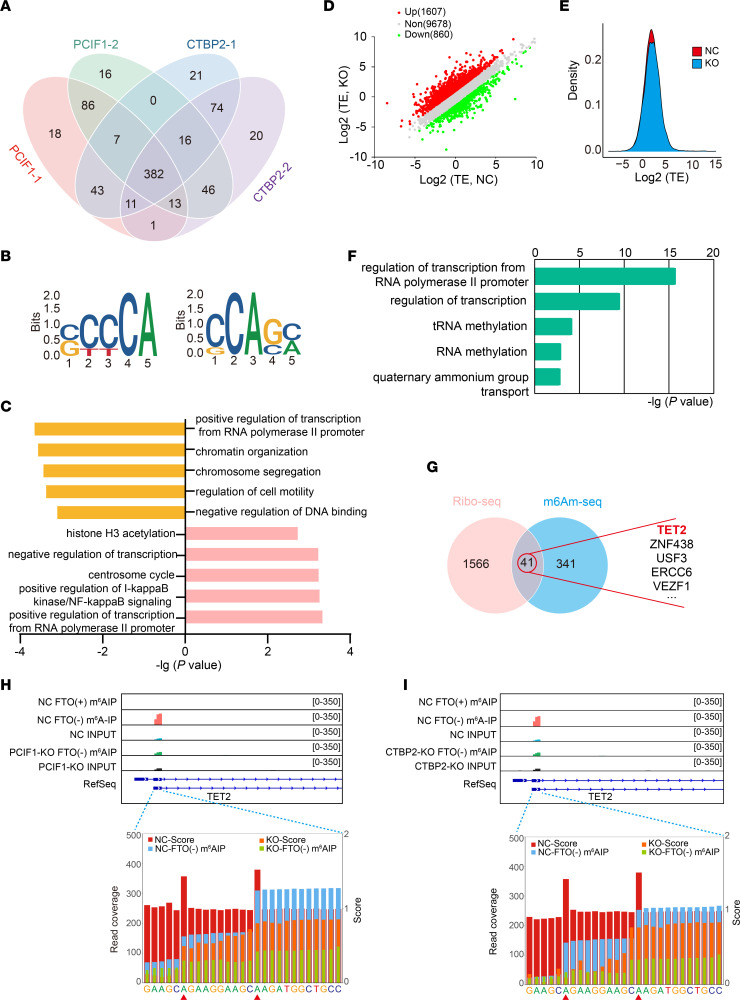
Figure 4. m6Am-Seq identifies TET2 as a target of CTBP2 and PCIF1.
(A) Venn diagram shows the integration of PCIF1-dependent modified genes and CTBP2-dependent modified genes; 382 genes are consistently modified by PCIF1 and CTBP2. (B) The top consensus m6Am motif identified in SCC25 cells with or without PCIF1 KO (left) and SCC25 cells with or without CTBP2 KO (right). (C) Bar plots showing the top 5 GO terms (Biological Process, DAVID) for PCIF1-dependent modified genes (top) and CTBP2-dependent modified genes (bottom). (D) Scatterplot of the translation ratios (TRs) in PCIF1-WT and PCIF1-KO SCC25 cells. TRs were calculated by division of the ribosome-binding transcript signals by input RNA-Seq signals. The PCIF1-WT SCC25 cell group served as the NC group. (E) Cumulative distribution plot of the translation efficiency (TE) distribution in cells with or without PCIF1 KO. (F) Bar plots showing the top 5 GO terms of genes with increased TRs. (G) Venn diagram shows the intersection of genes in GO Biological Process terms (regulation of transcription) from genes with increased TRs (left) and PCIF1- and CTBP2-dependent modified genes (right). (H and I) Representative images of PCIF1-dependent modified (H) and CTBP2-dependent modified (I) single m6Am sites on the transcripts of TET2. The 2 adenosine residues with a high score (red bars) were defined as m6Am sites.

