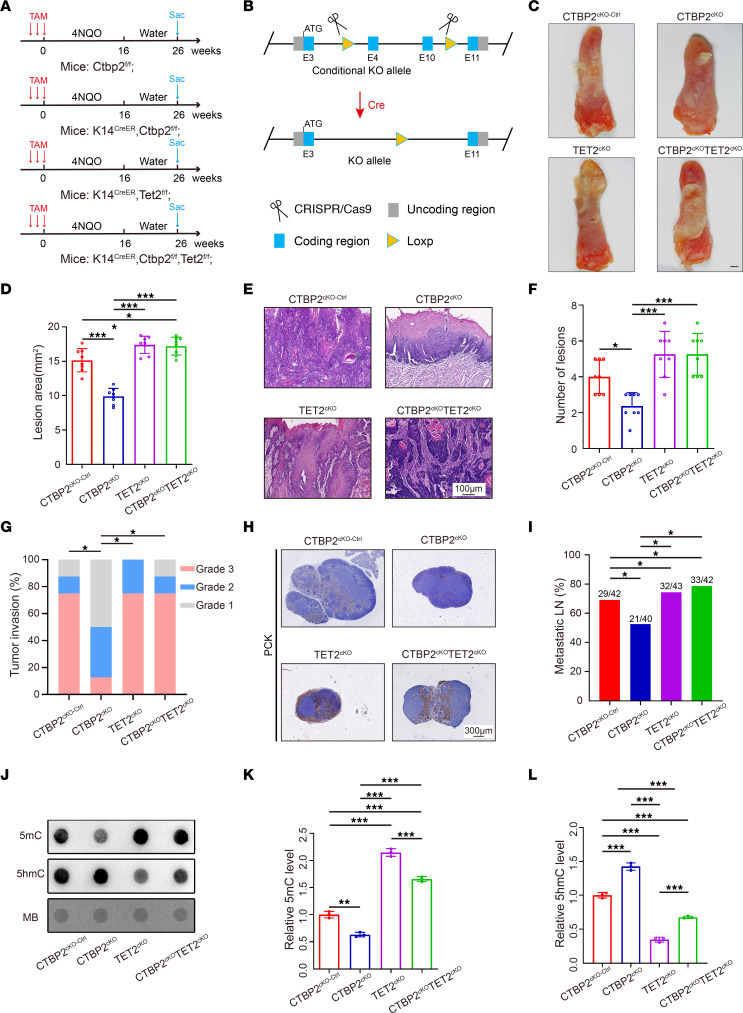
Figure 7. Conditional knockout of CTBP2 inhibits tumor growth and metastasis in vivo via enhanced expression of TET2.
(A) Experimental design of the carcinogen-induced HNSCC mouse model. (B) Diagram of Cre-dependent conditional knockout strategy for Ctbp2. (C) Representative image of visible tongue lesions in the indicated groups. Scale bar: 1 mm. (D) Quantification of HNSCC lesion area in the indicated groups (n = 8). *P < 0.05, ***P < 0.001 by 1-way ANOVA with Tukey’s multiple-comparison test. (E) Representative H&E staining of HNSCC in the indicated groups. Scale bar: 100 μm. (F) Quantification of HNSCC number of lesions in the indicated groups (n = 8). *P < 0.05, ***P < 0.001 by 1-way ANOVA with Tukey’s multiple-comparison test. (G) Quantification of HNSCC tumor grade in the indicated groups. *P < 0.05 by Pearson’s χ2 test. (H) Representative PCK staining of metastatic lymph node in the indicated groups. Scale bar: 300 μm. (I) Quantification of metastatic lymph node percentage in the indicated groups. *P < 0.05 by Pearson’s χ2 test. (J–L) Representative dot blot image (J) and quantitative analysis of DNA 5mC (K) and 5hmC (L) modification levels in the indicated groups (n = 3). **P < 0.01, ***P < 0.001 by 1-way ANOVA with Tukey’s multiple-comparison test.

