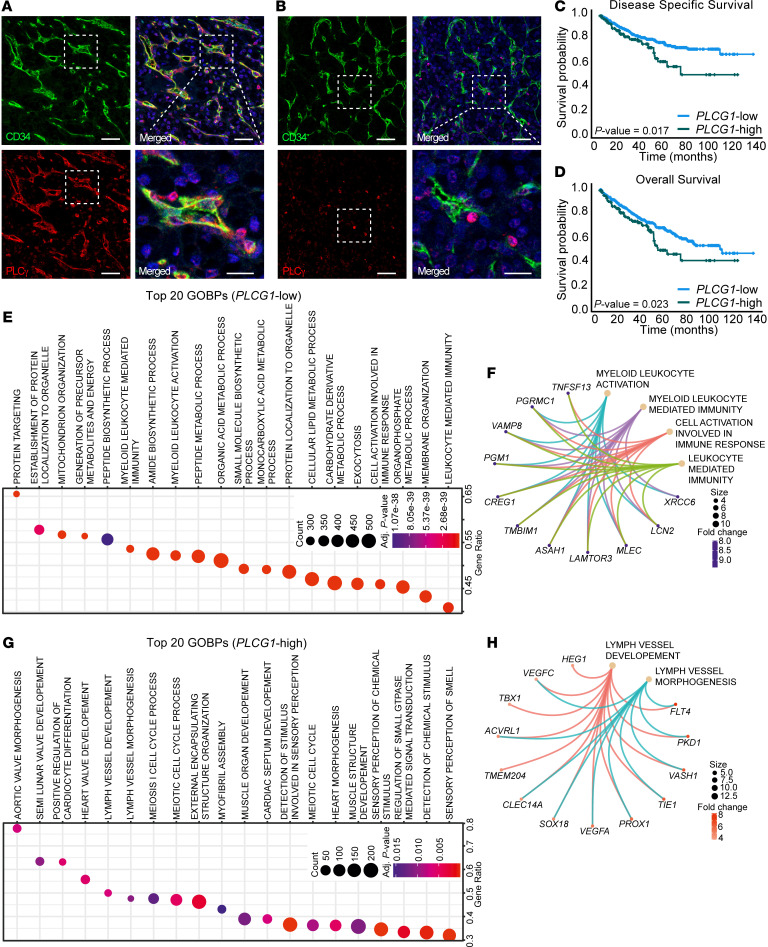
Figure 1. Tumor endothelial PLCγ expression correlates with worse patient survival and biological processes in patients with ccRCC.
(A and B) Representative images of patients with RCC positive (n = 5, A) and negative (n = 7; B) for vascular PLCγ expression. Scale bar: 50 μm. Lower right panels show magnifications from insets. Scale bar, 20 μm. (C and D) Kaplan-Meier curves showing correlative analysis of PLCG1 mRNA expression and disease specific survival (C) and overall survival (D) in the ccRCC TCGA data set (KIRC); n = 383 (PLCG1-low subgroup) and 127 patients (PLCG1-high subgroup). (E) Ranking of the 20 (GOBPs most enriched in the PLCG1-low subgroup (n = 383 patients) based on significance (Padj shown as heatmap) and ratio of affected genes within each GOBP. Overrepresentation analysis was performed based on a hypergeometric distribution corresponding to the 1-sided Fisher’s exact test (ClusterProfiler). (F) CNET plot showing networks of top differentially expressed genes (DEGs) in the immune activity GOBPs listed in E. (G) Ranking as in E, of the 20 most enriched GOBPs in the PLCG1-high subgroup (n = 127 patients). (H) CNET plot showing network of top DEGs in the indicated GOBPs in G.

