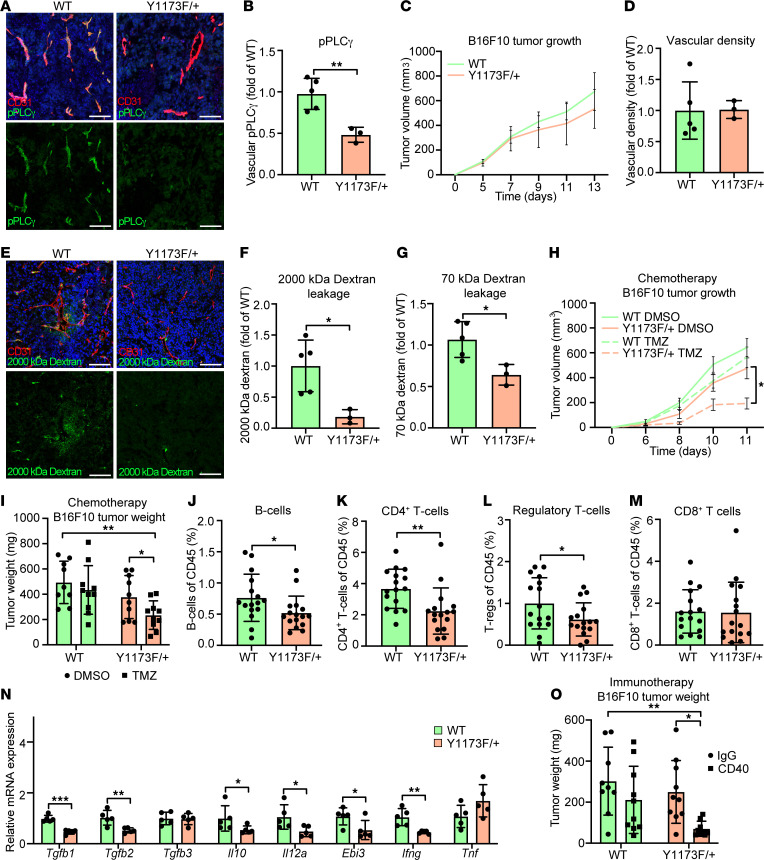
Figure 2. VEGFR2 pY1173/PLCγ signaling in experimental tumors affects vascular leakage, response to therapy, and antitumor immunity.
(A and B) Immunostaining (A) and mean fluorescent intensity (MFI) quantification (B) of pPLCγ Y783 in Vegfr2+/+ (WT) and Vegfr2Y1173F/+ (Y1173F/+) B16F10 melanoma tumors; n = 5 (WT) and 3 (Y1173F/+) mice, ≥ 3 fields of view/experiment. Scale bar: 100 μm. Unpaired 2-tailed Students’ t test. (C) Tumor growth of WT and Y1173F/+ B16F10 tumors; n = 5 (WT) and 3 (Y1173F/+) mice. 1-way ANOVA. (D) Quantification of vessel density (MFI) from A; n = 5 (WT) and 3 (Y1173F/+) mice, ≥ 3 fields of view/tumor. Unpaired 2-tailed Students’ t test. (E and F) Representative image (E) and quantification (F) of extravasated fixable 2,000 kDa FITC-dextran in B16F10 tumors; n = 5 (WT) and 3 (Y1173F/+) mice, ≥ 3 fields of view/experiment. Scale bar:100 μm. Unpaired 2-tailed Students’ t test. (G) Fluorescent intensity of 70 kDa TRITC-dextran extracted from B16F10 tumors; n = 5 (WT) and 3 (Y1173F/+) mice. Unpaired 2-tailed Students’ t test. (H and I) Tumor growth (H) and tumor weights (I) of WT and Y1173F/+ B16F10 tumors treated with 5 mg/kg Temozolomide (TMZ) or DMSO control; n = 9–10 mice/group. 2-way ANOVA (H), 1-way ANOVA (I). (J–M) Percent B cells (CD19) (J), helper T cells (CD3 and CD4 costaining) (K), regulatory T cells (CD3, CD4, CD25, and Foxp3 costaining) (L), cytotoxic T cells (CD3 and CD8 costaining) (M) in WT and Y1173F/+ B16F10 tumors; n = 16/genotype. Unpaired 2-tailed Students’ t test. (N) mRNA expression of TGFβ (Tgfb1-3), IL10 (Il10), IL35 (Il12a, Ebi3), IFNγ (Ifng), and TNFα (Tnf) in WT and Y1173F/+ B16F10 tumors; n = 5 mice/genotype. Unpaired 2-tailed Students’ t test. (O) Tumor weight of CD40- or IgG-treated WT and Y1173F/+ B16F10 tumors harvested at day 12; n = 9–10 mice/group. 1-way ANOVA. Data represent mean ± SD or SEM (H). *P < 0.05, **P < 0.01, ***P < 0.001.

