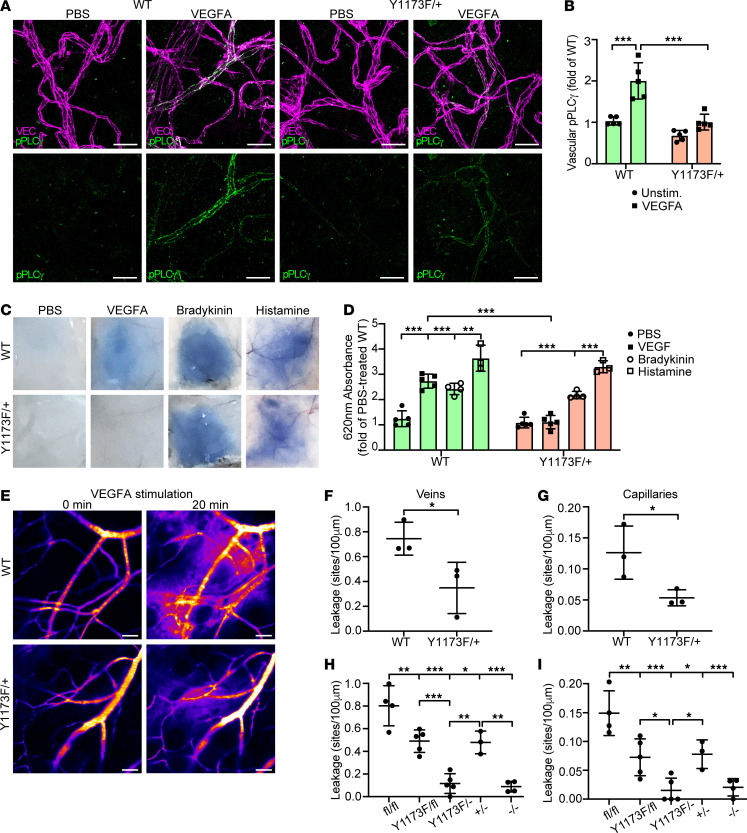
Figure 3. VEGFR2 pY1173 signaling regulates VEGFA-induced vascular permeability in the healthy skin.
(A) Representative images of immunofluorescent staining for VE-cadherin (VEC) and pPLCγ Y783 in the back skin of Vegfr2+/+ WT and Vegfr2Y1173F/+ heterozygous (Y1173F/+) mice, subsequent to intradermal injection of PBS or VEGFA. Scale bar: 20 μm. (B) Quantification of mean fluorescent intensity of vascular pPLCγ Y783 from A; n = 5 mice/genotype, ≥ 2 fields of view/mouse. 1-way ANOVA. (C) Representative images of Evans blue leakage in response to PBS, VEGFA, bradykinin, or histamine in the back skin of WT and Y1173F/+ mice. (D) Quantification (620 nm absorbance) of extravasated Evans blue from C. Values are shown as fold of PBS-treated control, normalized to tissue weight; n = 3–5 mice/group. 1-way ANOVA. (E) Representative time-lapse image of VEGFA-induced vascular permeability of 2,000 kDa FITC dextran in the ear dermis of WT and Y1173F/+ mice. Scale bar: 50 μm. (F and G) Number of leakage sites/100 μm in WT and Vegfr2Y1173F/+ mice, in veins (F) and capillaries (G); n = 3 mice/genotype, ≥ 2 fields of view/mouse. Unpaired 2-tailed Students’ t test. (H and I) Ear dermis leakage in response to VEGFA in tamoxifen-treated Vegfr2fl/fl; Cdh5-Cre– (fl/fl), Vegfr2Y1173F/fl; Cdh5-Cre– (Y1173F/fl), Vegfr2Y1173F/fl; Cdh5-Cre+ (Y1173F/–), Vegfr+/fl; Cdh5-Cre+ (+/–), Vegfr2fl/fl; Cdh5-Cre+ (–/–), quantified as leakage sites/100 μm, in veins (H) and capillaries (I); n = 3–5 mice/genotype, ≥ 2 fields of view/mouse. 1-way ANOVA. Data represent mean ± SD. *P < 0.05, **P < 0.01, ***P < 0.001.

