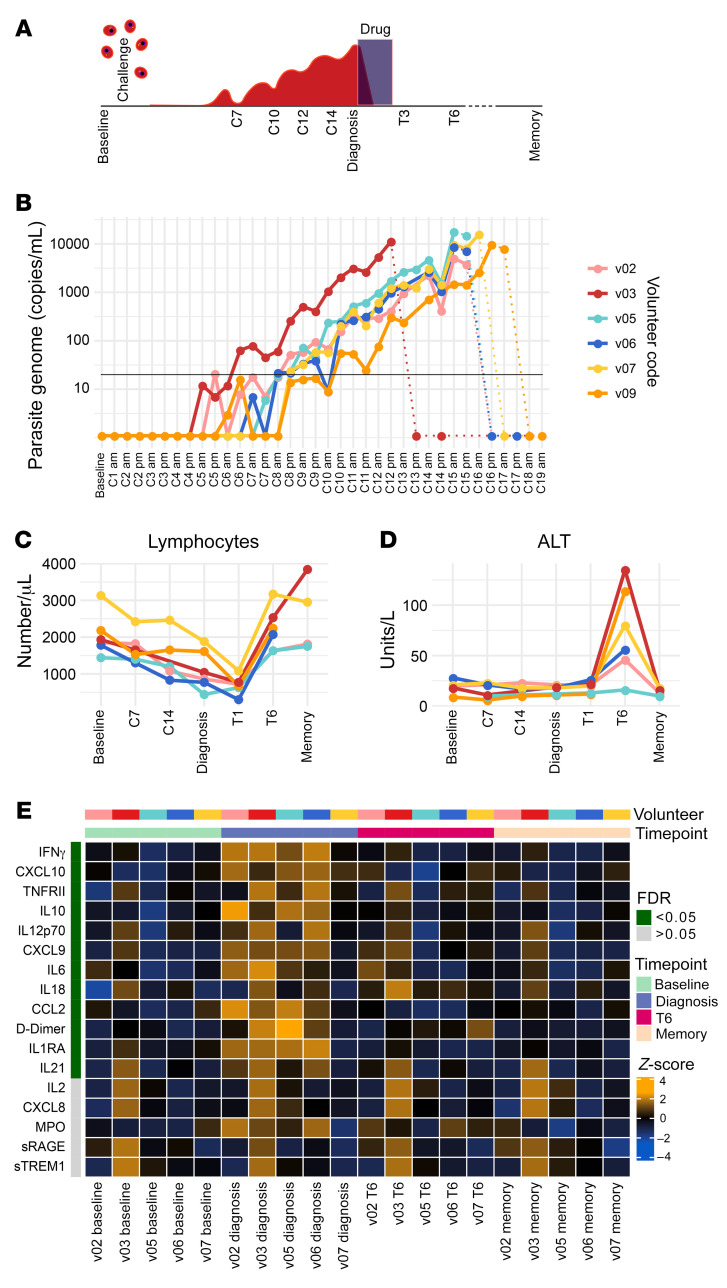
Figure 1. Plasmodium vivax triggers IFN-stimulated inflammation.
(A) Study design and sampling time points. (B) Circulating parasite density was determined twice daily by qPCR. Pretreatment measurements are shown as solid lines, posttreatment measurements as dotted lines. The limit of quantification (20 genome copies/mL) is shown by a black line. (C and D) Full blood counts and blood chemistry measured (C) lymphocyte frequencies and (D) the concentration of alanine aminotransferase (ALT) throughout infection and convalescence. In B–D, each line represents 1 volunteer (n = 6). (E) Multiplexed plasma analytes were measured using a custom Legendplex assay. Each row in the heatmap is an analyte and each column a plasma sample. Samples from v09 were excluded after failing QC (n = 5). Linear regression was used to identify analytes that varied across the volunteer cohort at each time point (compared with baseline) and these are ordered by FDR. FDR < 0.05 was considered significant after adjusting for multiple testing (Benjamini-Hochberg). Only 17 of the 39 analytes measured are shown (those with the lowest FDR) and the color of each tile corresponds to the row-wise z score–transformed concentrations. In C and D, the memory time point is 90 days after challenge and in E, memory is 45 days after challenge.

