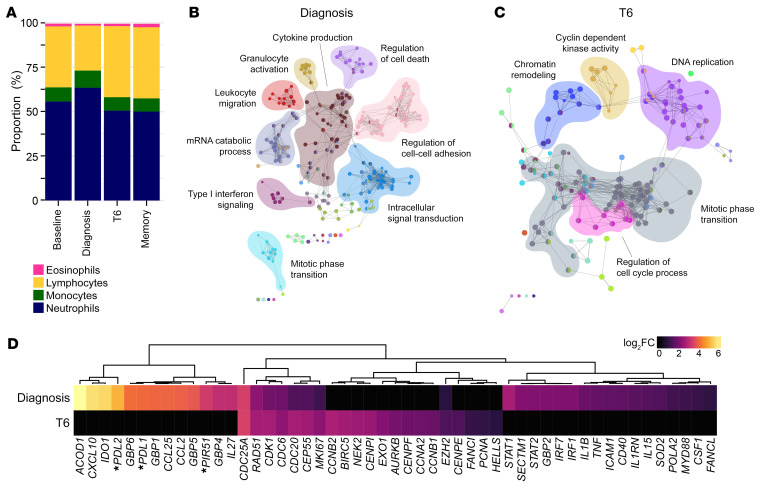
Figure 2. Inflammation is followed by a transcriptional signature of proliferation.
(A) Proportion of lymphocytes, monocytes, neutrophils, and eosinophils in whole blood at baseline, diagnosis, T6, and 90 days after challenge (memory). The mean frequency is shown for each time point (n = 6). Note that the relative increase in abundance of myeloid cells between baseline and diagnosis is 13.6%. (B and C) Genes that were differentially expressed in whole blood at diagnosis (B) and T6 (C) (relative to baseline, Padj < 0.05 and fold-change > 1.5) were used to create a gene ontology (GO) network in ClueGO. Each node represents a GO term and node size is determined by enrichment-adjusted P value. GO terms that share more than 40% of genes are connected by a line and organized into discrete functional groups (each given a unique color). The major functional groups are highlighted and labeled with a representative GO term. (D) The log2(fold-change) (log2FC) of signature genes associated with IFN signaling, type I inflammation, and proliferation are shown in whole blood at diagnosis and T6 (relative to baseline). Genes are ordered by unsupervised hierarchical clustering (denoted by the dendrogram) and those that were not differentially expressed (Padj > 0.05) are shown with a fold-change of zero. Asterisks indicate that common gene names have been used. In B–D, n = 6 per time point.

