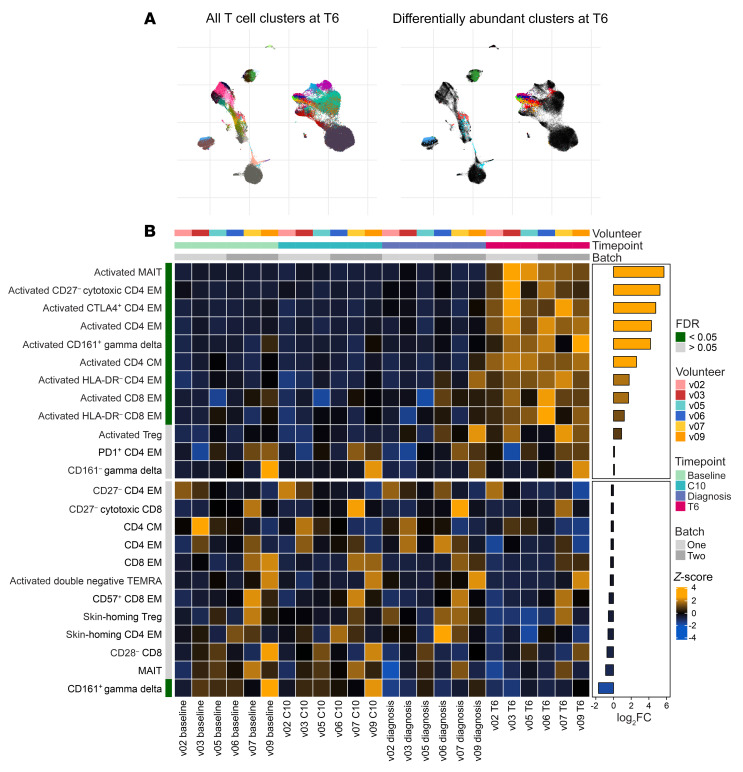
Figure 4. Plasmodiumvivax activates every T cell lineage.
(A) UMAP plot showing all 34 T cell clusters (left) and those that were differentially abundant at T6 (right) (relative to baseline, FDR < 0.05 and fold-change > 2). Data from all volunteers and time points were concatenated for clustering, and each cluster has a unique color. (B) Heatmap showing the relative abundance of T cell clusters through time. Each row is a T cell cluster and each column a sample; clusters are ordered by log2(fold-change) (log2FC) at T6 (relative to baseline). Only 24 of the 34 T cell clusters are shown (those with the lowest FDR) and tiles are colored according to row-wise z scores of (arcsine square root–transformed) cluster frequencies. In A and B, n = 6 per time point. EM, effector memory; CM, central memory.

