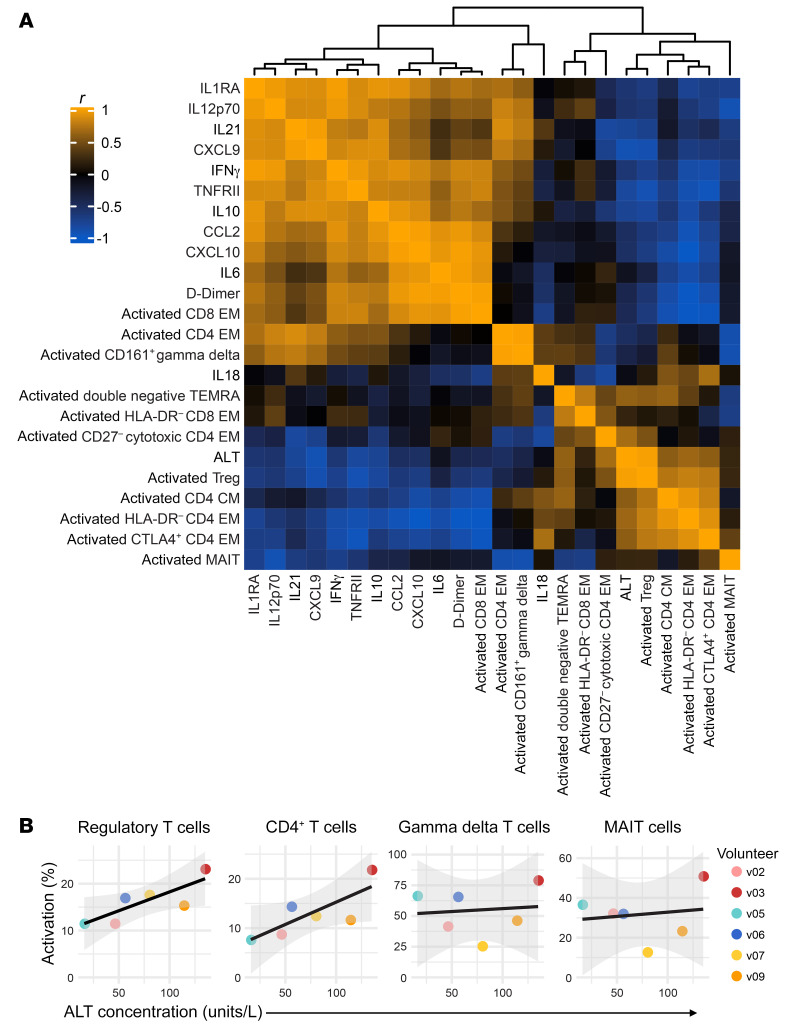
Figure 6. T cell activation is independent of systemic inflammation.
(A) Heatmap showing a Pearson’s correlation matrix of the log2-transformed fold-change of each activated T cell cluster and the 12 most variable plasma analytes (FDR < 0.05). The fold-change was calculated either at diagnosis or T6 (relative to baseline) according to when this was largest for each feature. The absolute concentration of plasma ALT at T6 (the peak of the response) is also included. The order of features was determined by hierarchical clustering and the associated dendrogram is shown at the top of the heatmap. (B) Correlation between ALT concentration and the frequency of activated (CD38hiBcl2lo) T cells at T6. Note that innate-like and adaptive T cell clusters belonging to the same lineage were merged to analyze their relationship with collateral tissue damage at a subset level. Regression lines are shown in black and the 95% confidence intervals in gray. In A and B, n = 6 per time point. EM, effector memory; CM, central memory.

