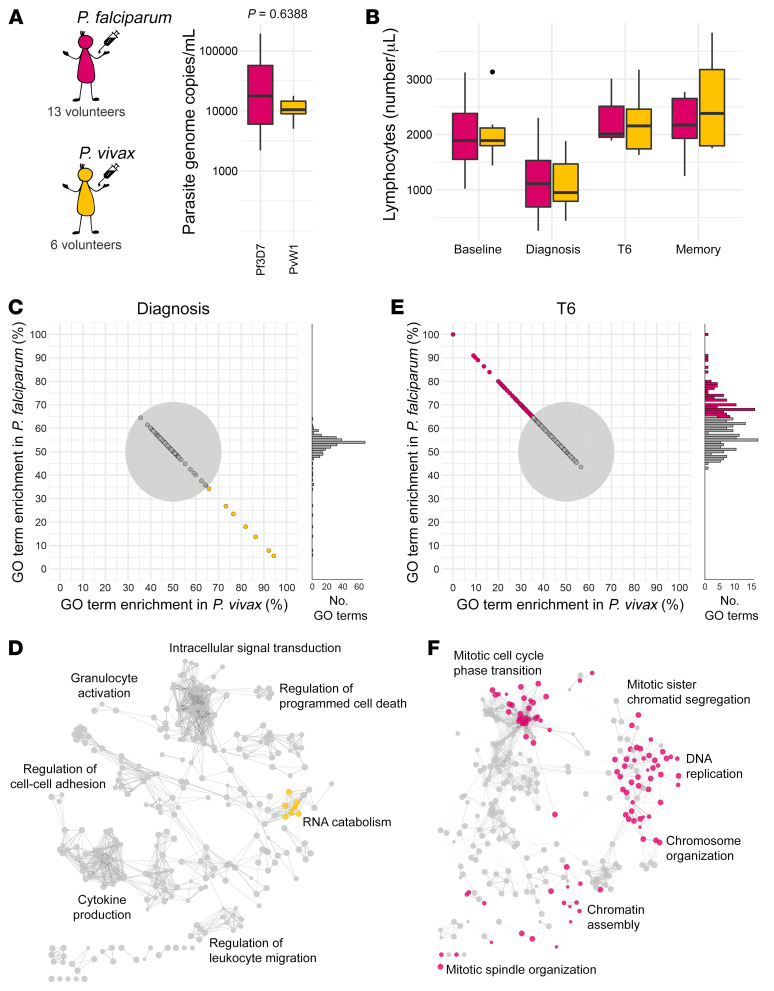
Figure 7. The host response is shaped by parasite species.
(A) The maximum circulating parasite density in each volunteer during the VAC063/VAC063C CHMI trials (Plasmodium falciparum) and the VAC069A study (Plasmodium vivax). Significance between parasite species was assessed by 2-tailed Wilcoxon’s rank-sum exact test. (B) The total number of circulating lymphocytes through infection and convalescence; the memory time point is 90 days after challenge. In A and B, box (median and IQR) and whisker (1.5× upper or lower IQR) plots are shown with outliers as dots; n = 13 for P. falciparum and n = 6 for P. vivax (except at T6, where n = 3 for P. falciparum). (C–F) Whole blood RNA sequencing was performed identically during the VAC063/VAC063C and VAC069A studies and lists of differentially expressed genes (Padj < 0.05 and fold-change > 1.5) were combined for GO analysis at diagnosis and T6. Importantly, for every GO term the fraction of associated genes derived from each volunteer cohort was retained. (C and E) Each GO term is represented by a single point and these are positioned according to the proportion of genes that were differentially expressed in volunteers infected with P. falciparum or P. vivax. The gray circle represents a 65% threshold that needed to be crossed to call a GO term as predominantly derived from 1 volunteer cohort; beyond this threshold GO terms are colored by enrichment as shown in A. (D and F) ClueGO networks reveal the functional organization of GO terms at diagnosis (D) and T6 (F); nodes are color-coded by enrichment (shared GO terms are shown in gray) and each of the major functional groups is labeled with a representative GO term. In C and D, n = 13 for P. falciparum and n = 6 for P. vivax and in E and F, n = 3 and 6, respectively.

