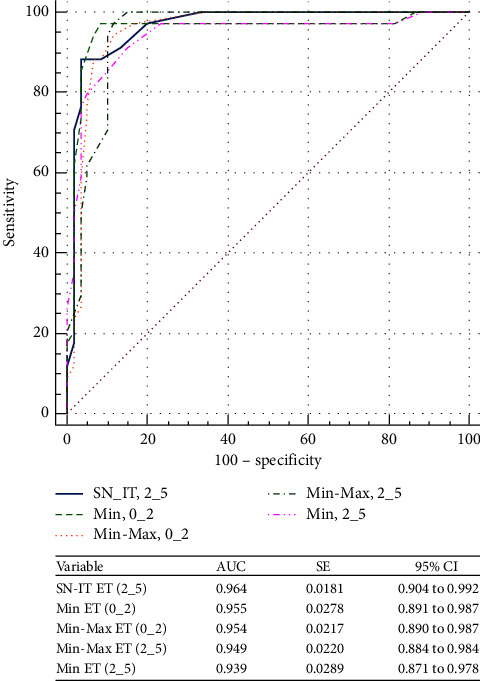
Figure 6.

Comparison of the epithelial thickness parameters that showed the best area under the receiver operating characteristic curves to differentiate between keratoconus and normal eyes. SN-IT = superonasal-inferotemporal; ET = epithelial thickness; Min = minimum; Min-Max = minimum-maximum; AUC = area under the receiver operating characteristic curve; SE = standard error; CI = confidence interval.
