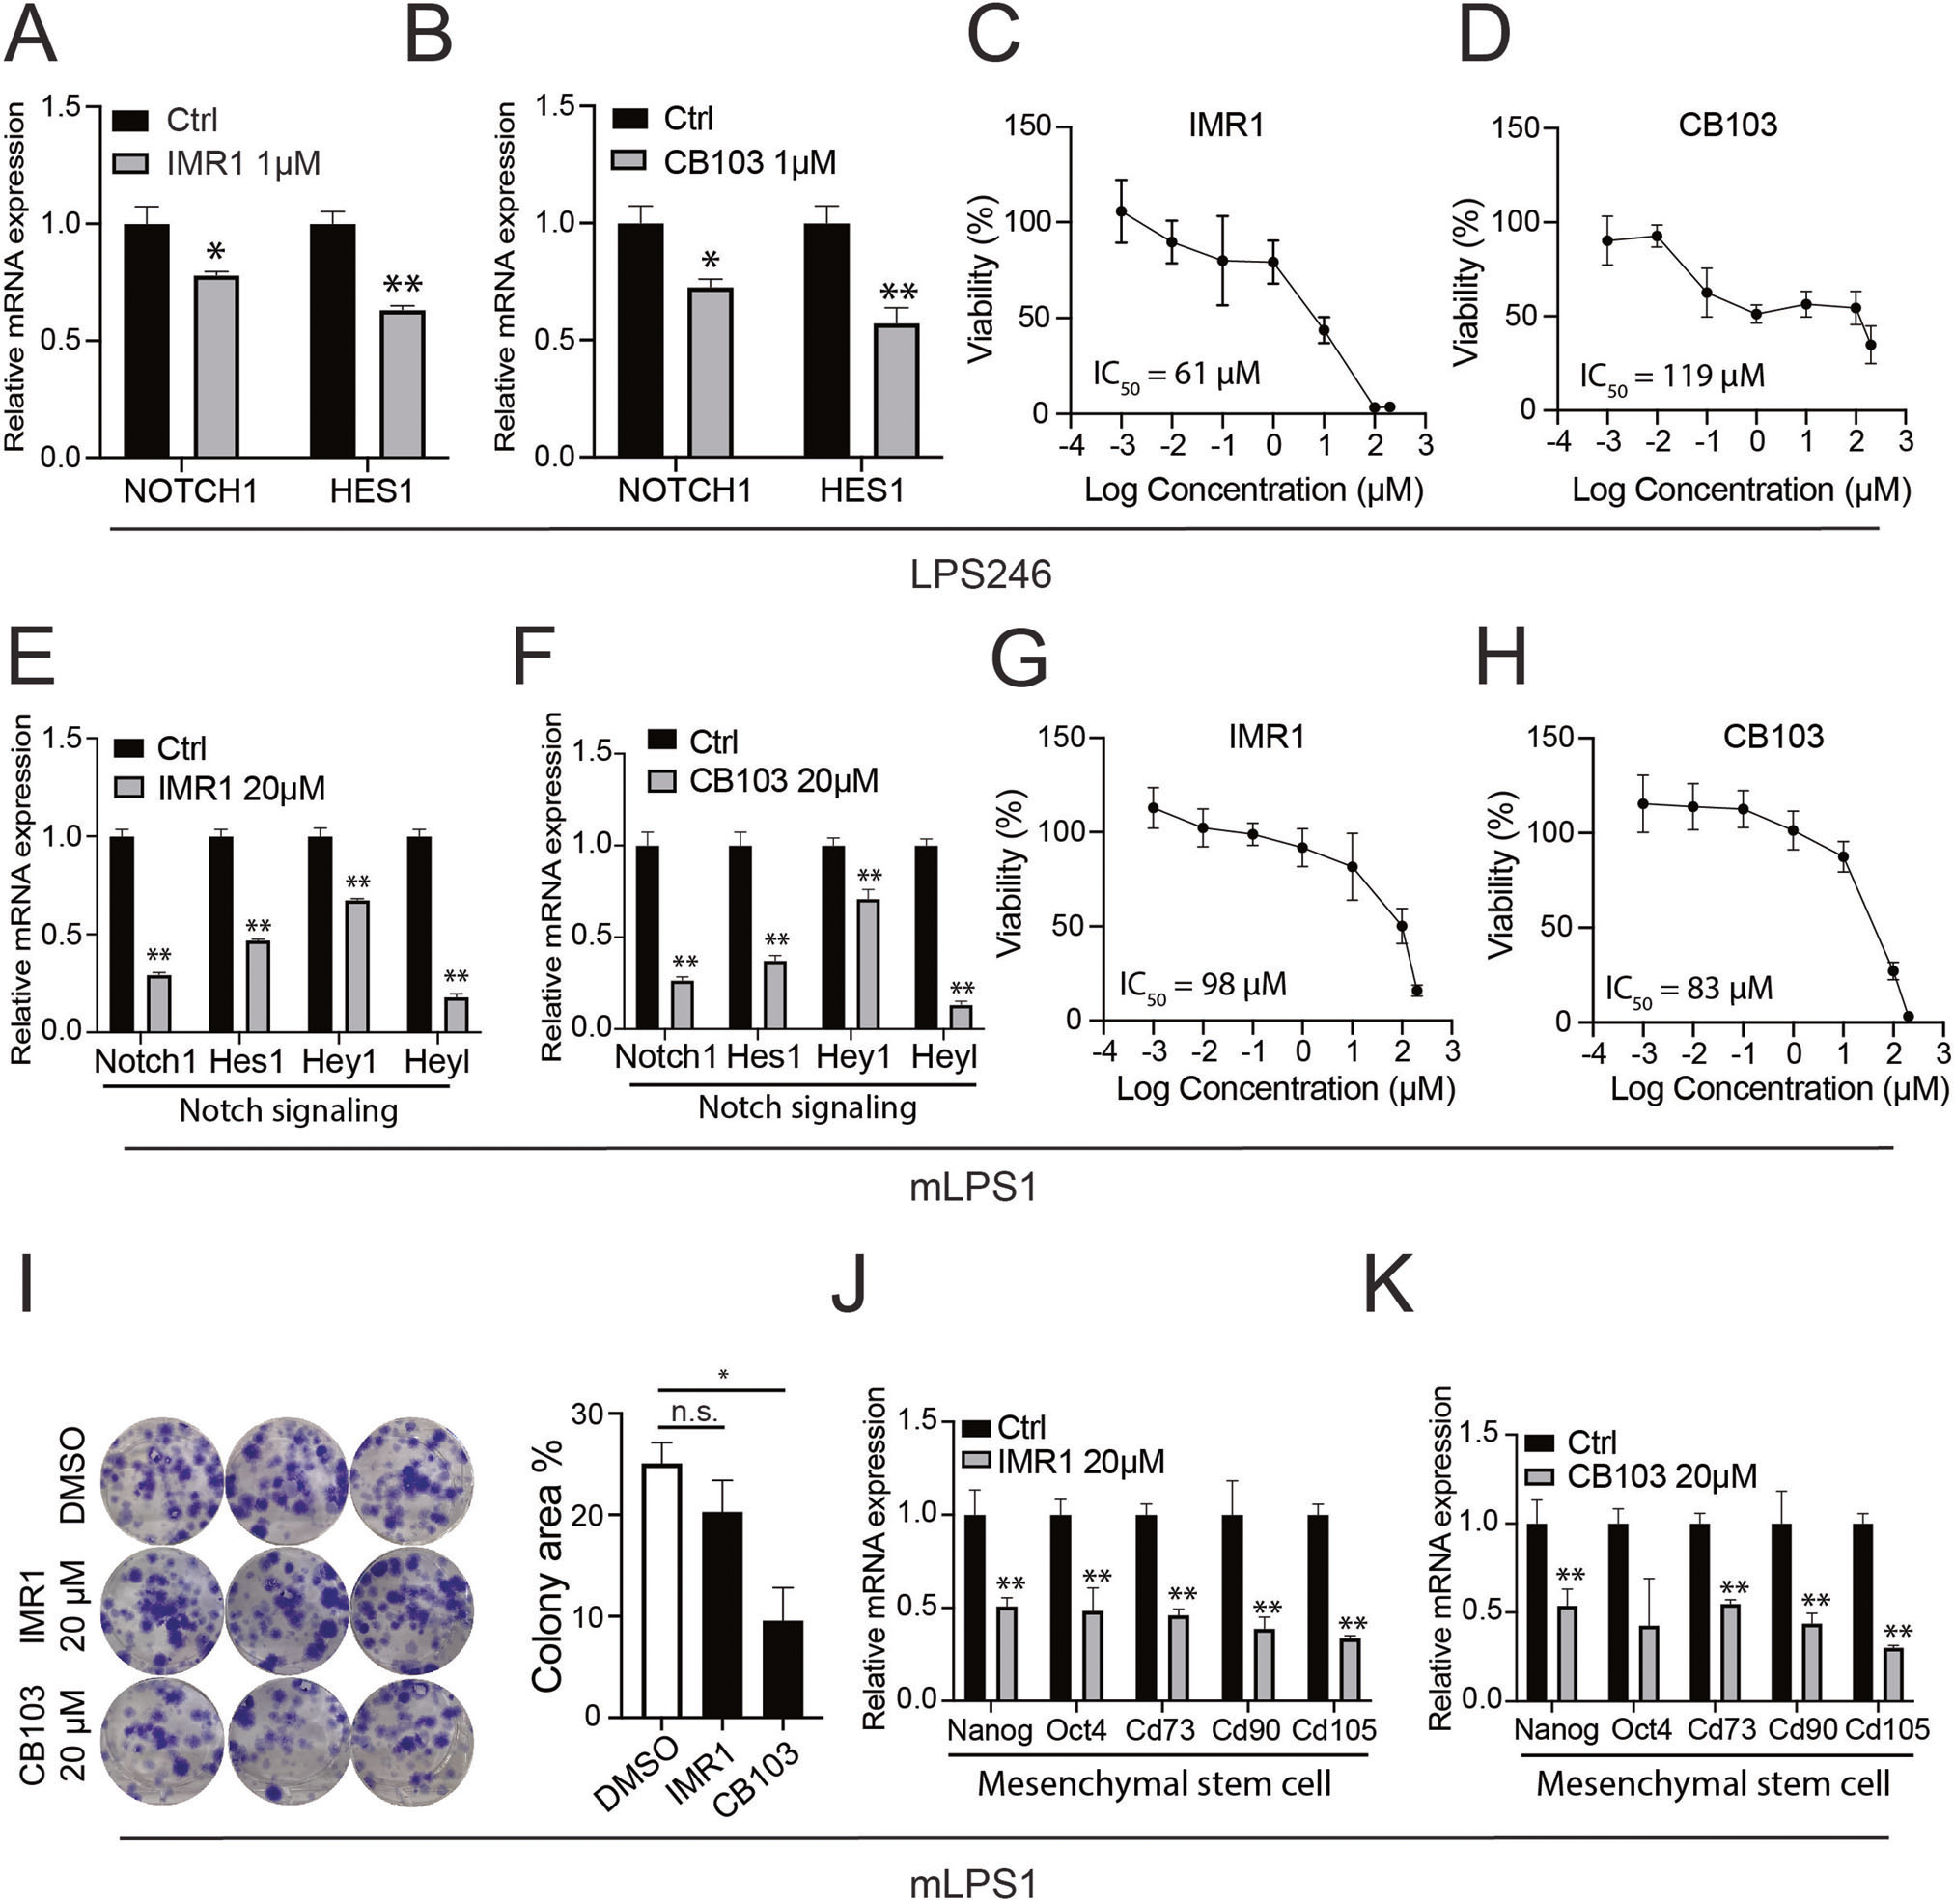
Fig. 2. Effect of Notch transcriptional inhibitors (IMR1 and CB103) on human LPS246 and murine mLPS1 cells.

A, B RT-qPCR showing that IMR1 and CB103 inhibits NOTCH1 and HES1 gene expression in LPS246 cells (n = 3). C, D Representative dose-response curves of LPS246 to varying concentrations of IMR1 and CB103, and the corresponding and IC50 values (n = 6). E, F Relative levels of Notch related genes in mLPS1 cells treated with IMR1 or CB103 (n = 3). G, H Representative dose-response curves of mLPS1 to varying concentrations of IMR1 and CB103 and the corresponding IC50 values (n = 6). I Clone formation assay of mLPS1 cells treated with vehicle control (DMSO), IMR1, or CB103 (n = 3) (left), and the quantification of colony area (right). J, K Effect of IMR1 and CB103 on mRNA levels of cancer stem cell markers in mLPS1 cells (n = 3). Data are presented as mean ± SD, *P < 0.05, **P < 0.001.
