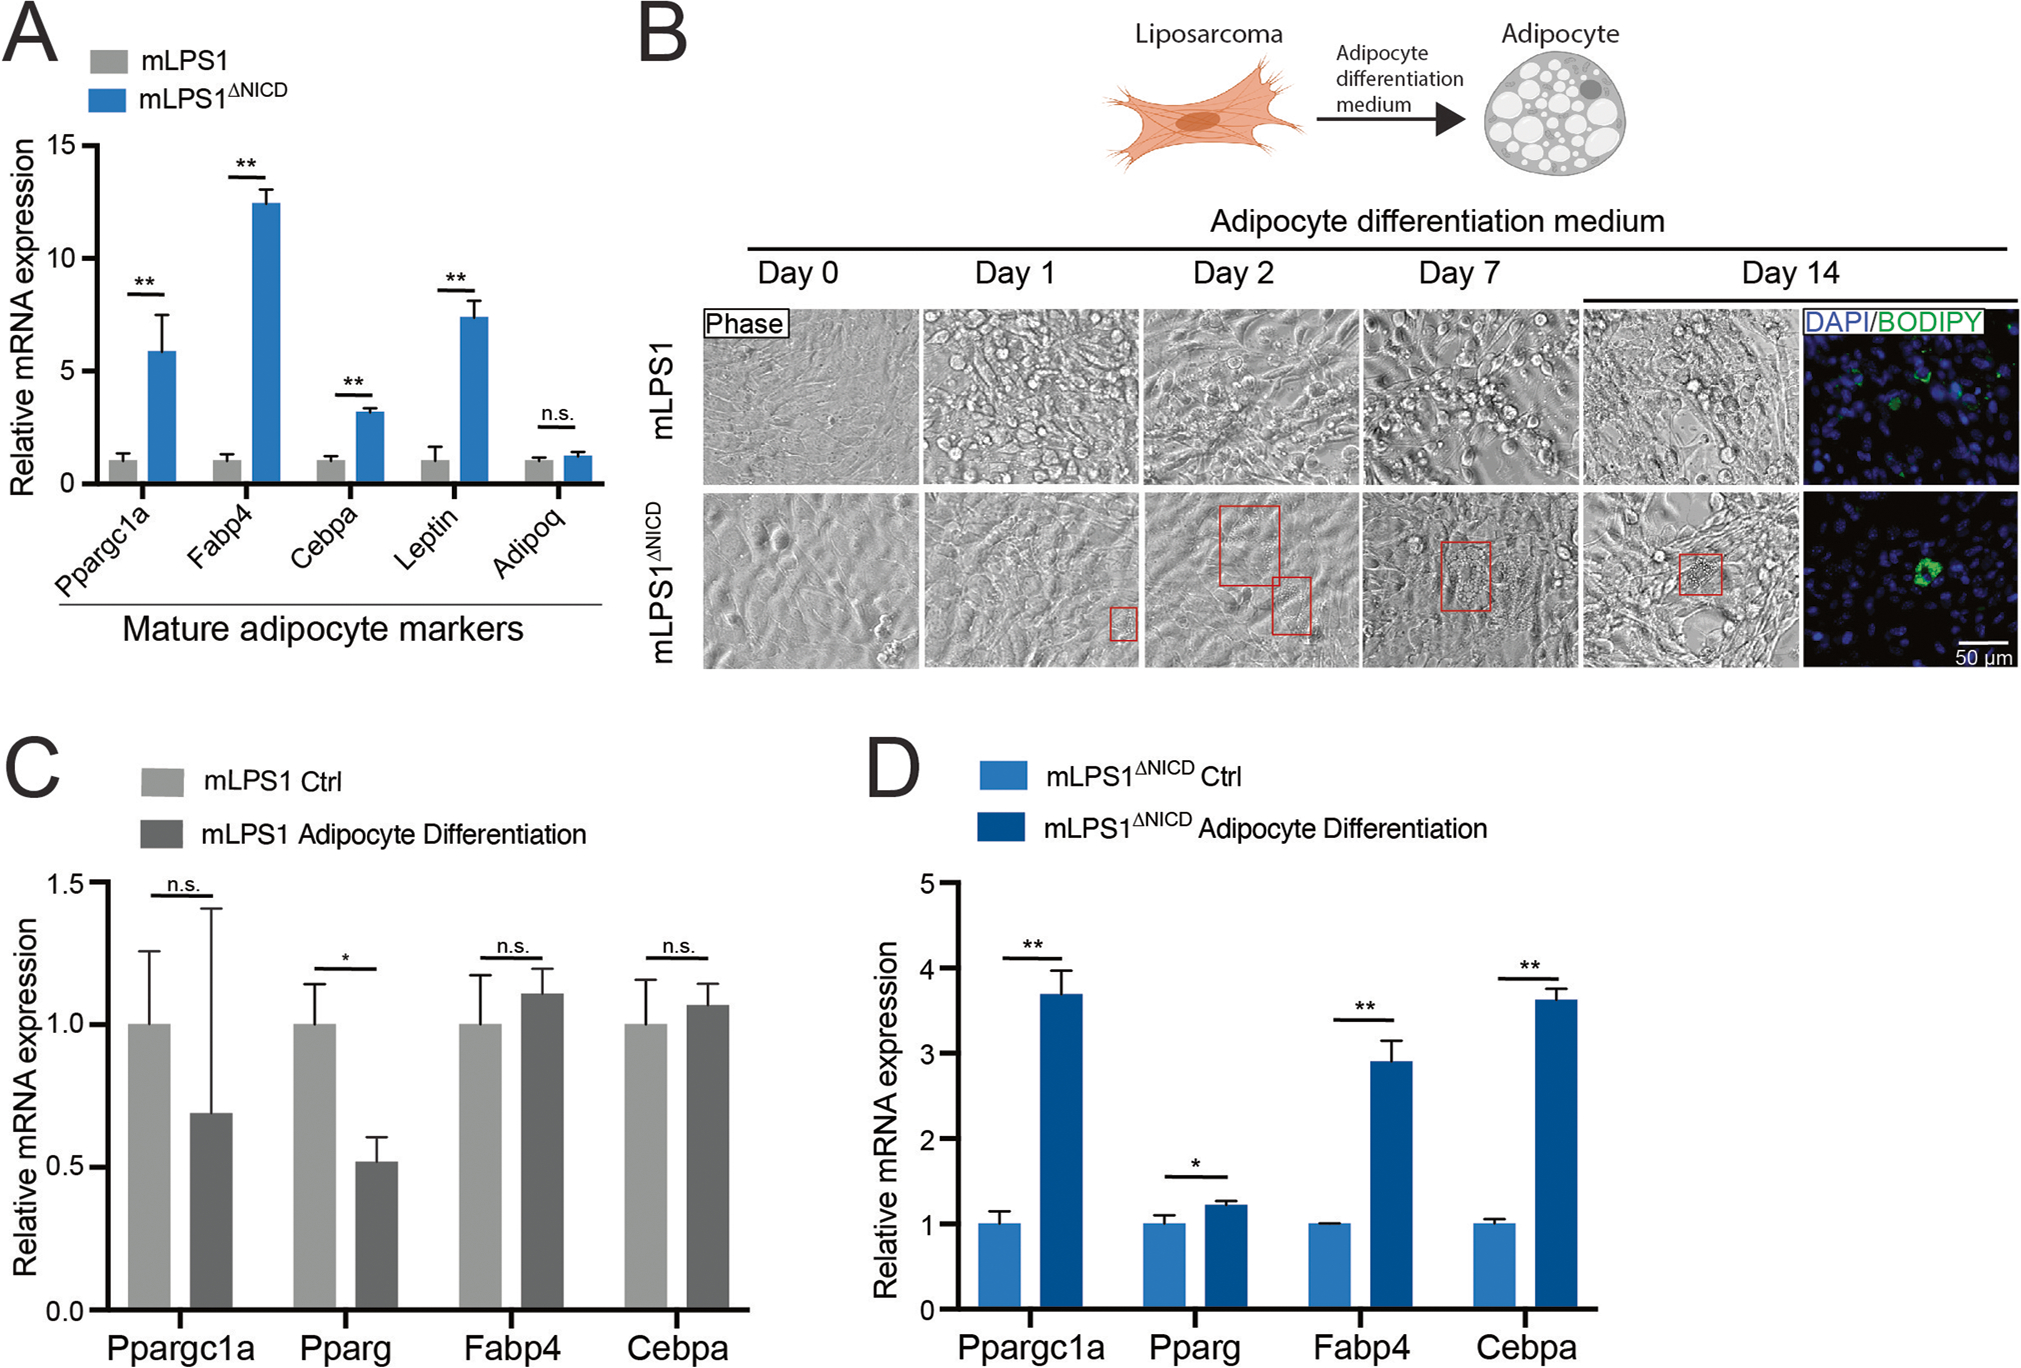
Fig. 4. Notch activation suppresses mLPS1 cell differentiation into adipocytes.

A RT-qPCR analysis showing expression of mature adipocyte marker genes in mLPS1 and mLPS1ΔNICD cells. B Fluorescent staining images of lipid droplets (labeled with BODIPY in green as indicator of adipogenic differentiation) in mLPS1 and mLPS1ΔNICD cells after treated with adipocyte differentiation medium, visualized by immunofluorescence microscopy. Scale bars, 50 μm. Nuclei were counterstained with DAPI (blue). C RT-qPCR analysis showing relative levels of mature adipocyte markers in mLPS1 cells at 24 h after expose to adipocyte differentiation medium. D RT-qPCR analysis of mature adipocyte marker expression levels in mLPS1ΔNICD cells at 24 h after expose to adipocyte differentiation medium. Data are represented as mean ± SD. *P < 0.05, **P < 0.001. n.s., not significant.
