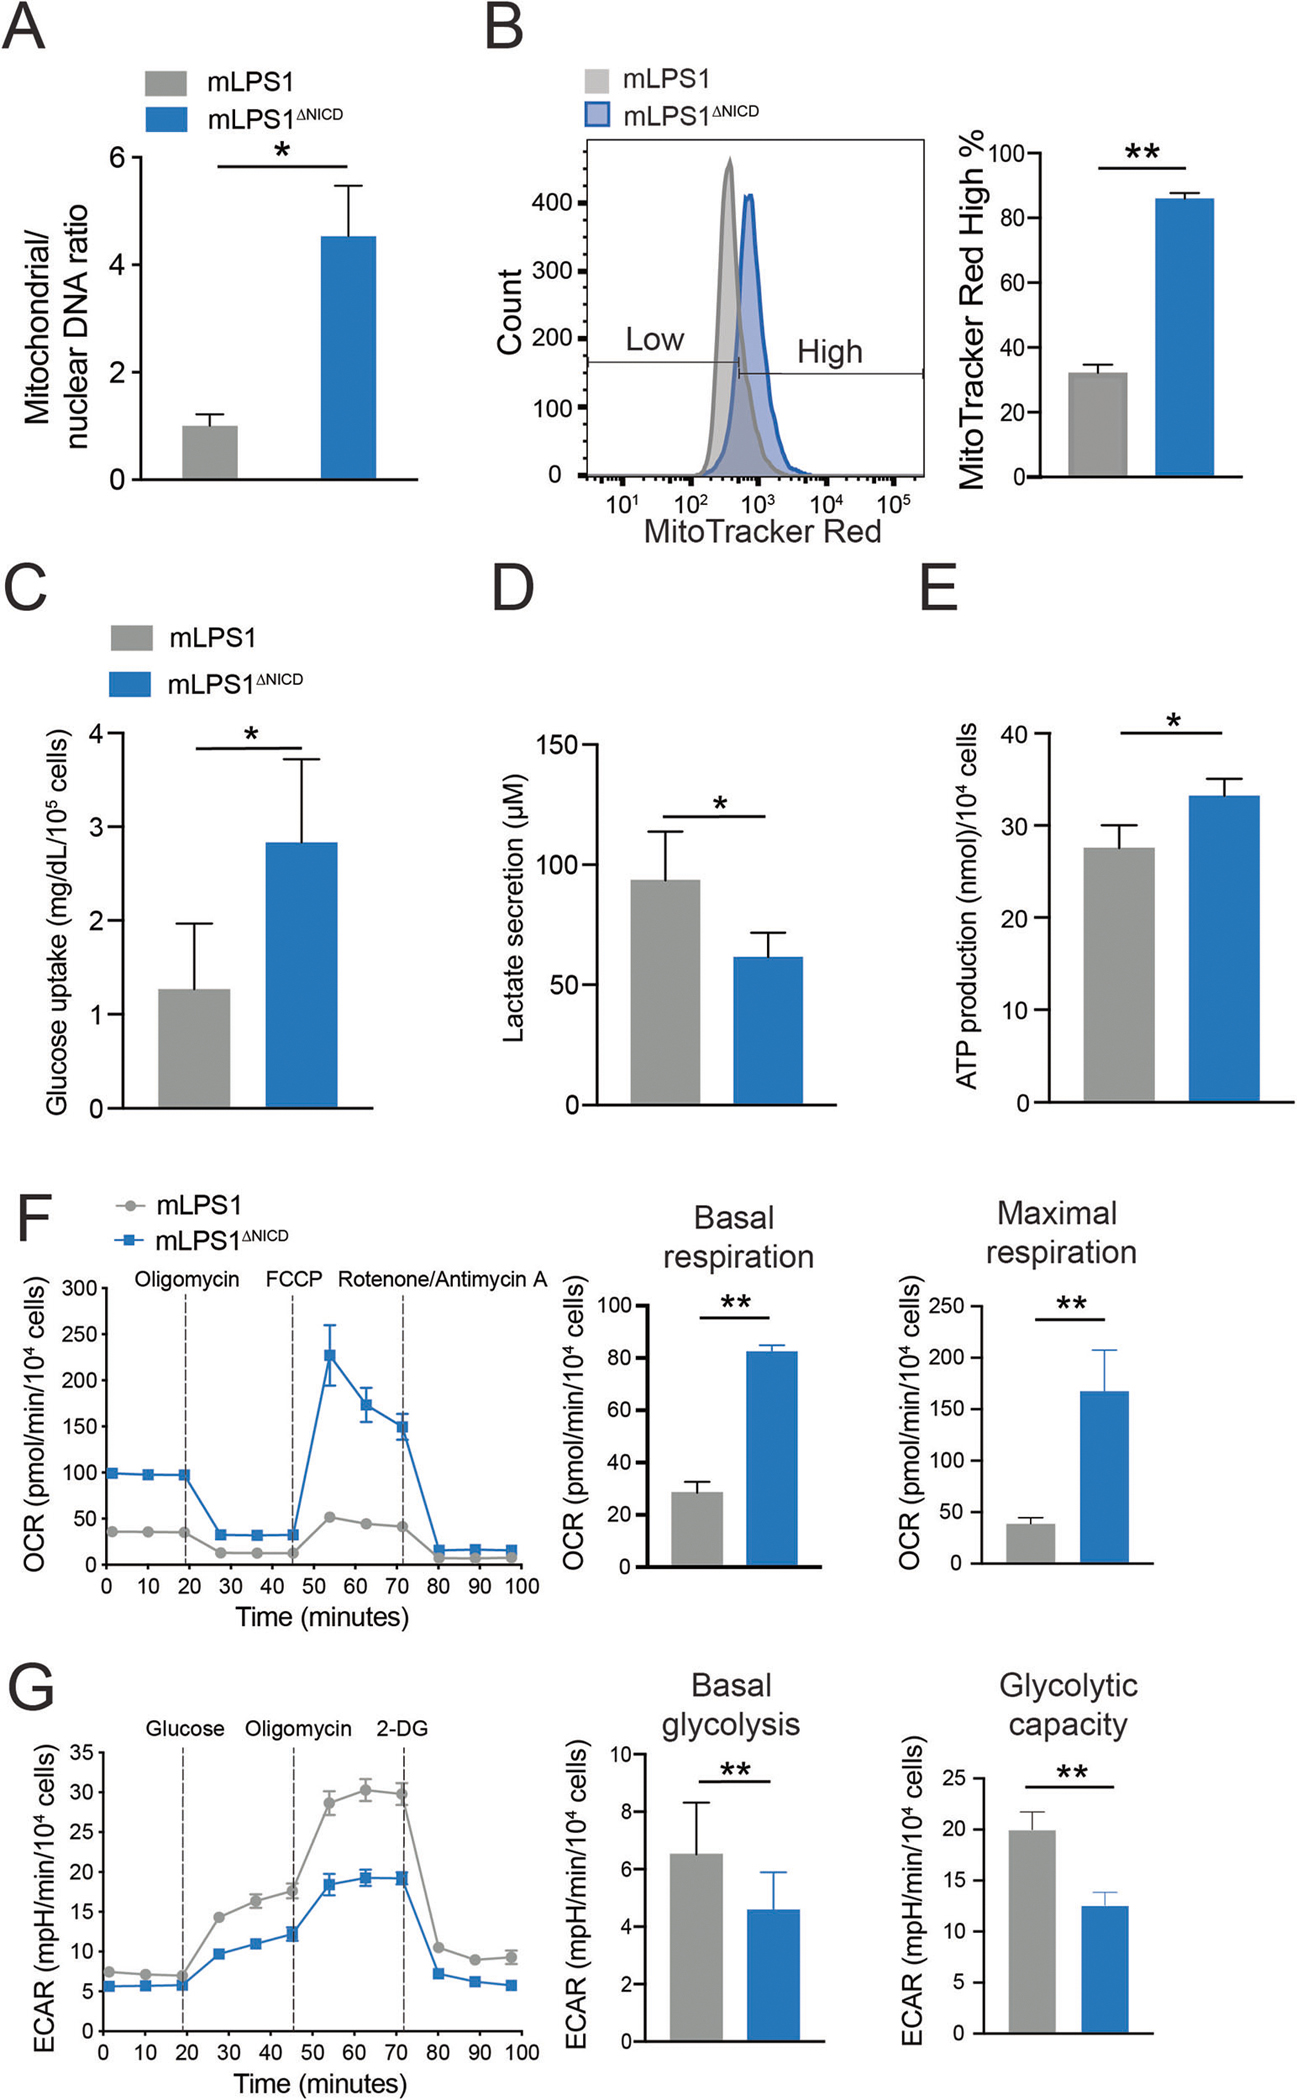
Fig. 5. Notch signaling regulates mitochondrial biogenesis and respiration in mLPS1 cells.

A RT-qPCR analysis of mitochondrial DNA (MT-ND1) versus nuclear DNA (HK2) content in mLPS1 and mLPS1ΔNICD cells (n = 3). B mLPS1 and mLPS1ΔNICD cells were stained with the MitoTracker Red FM probe and analyzed by Flow cytometry (n = 3). Histograms show the fluorescence intensity corresponding to mitochondrial mass (left) and quantification of high MitoTracker signal cells (right). C Glucose uptake of mLPS1 and mLPS1ΔNICD cells based on measuring reduction of glucose in culture media over 6 h (n = 4). D lactate production (n = 6) of mLPS1 and mLPS1ΔNICD cells based on measuring lactate concentration in culture media over 16 h. E ATP production (n = 6) of mLPS1 and mLPS1ΔNICD cells based on measuring chemical luminescence signaling in cell after 20 min incubation with reaction buffer. F Cellular respiration was monitored using the Seahorse bioscience extracellular flux analyzer (Left). The oxygen consumption rate (OCR) was normalized to protein abundance. The OCR corresponding to basal respiration (middle) and maximal respiratory capacity (right) in mLPS1 and mLPS1ΔNICD cells were shown (n = 5). G Seahorse bioscience extracellular flux analysis of extracellular acidification rate (ECAR) in mLPS1 and mLPS1ΔNICD cells (left). The basal glycolysis (middle) and maximal glycolytic capacity (right) were quantified in bar graphs (n = 5). Data are presented as mean ± SD of three reading cycles, for each cycle n = 5, *P < 0.05, **P < 0.001.
