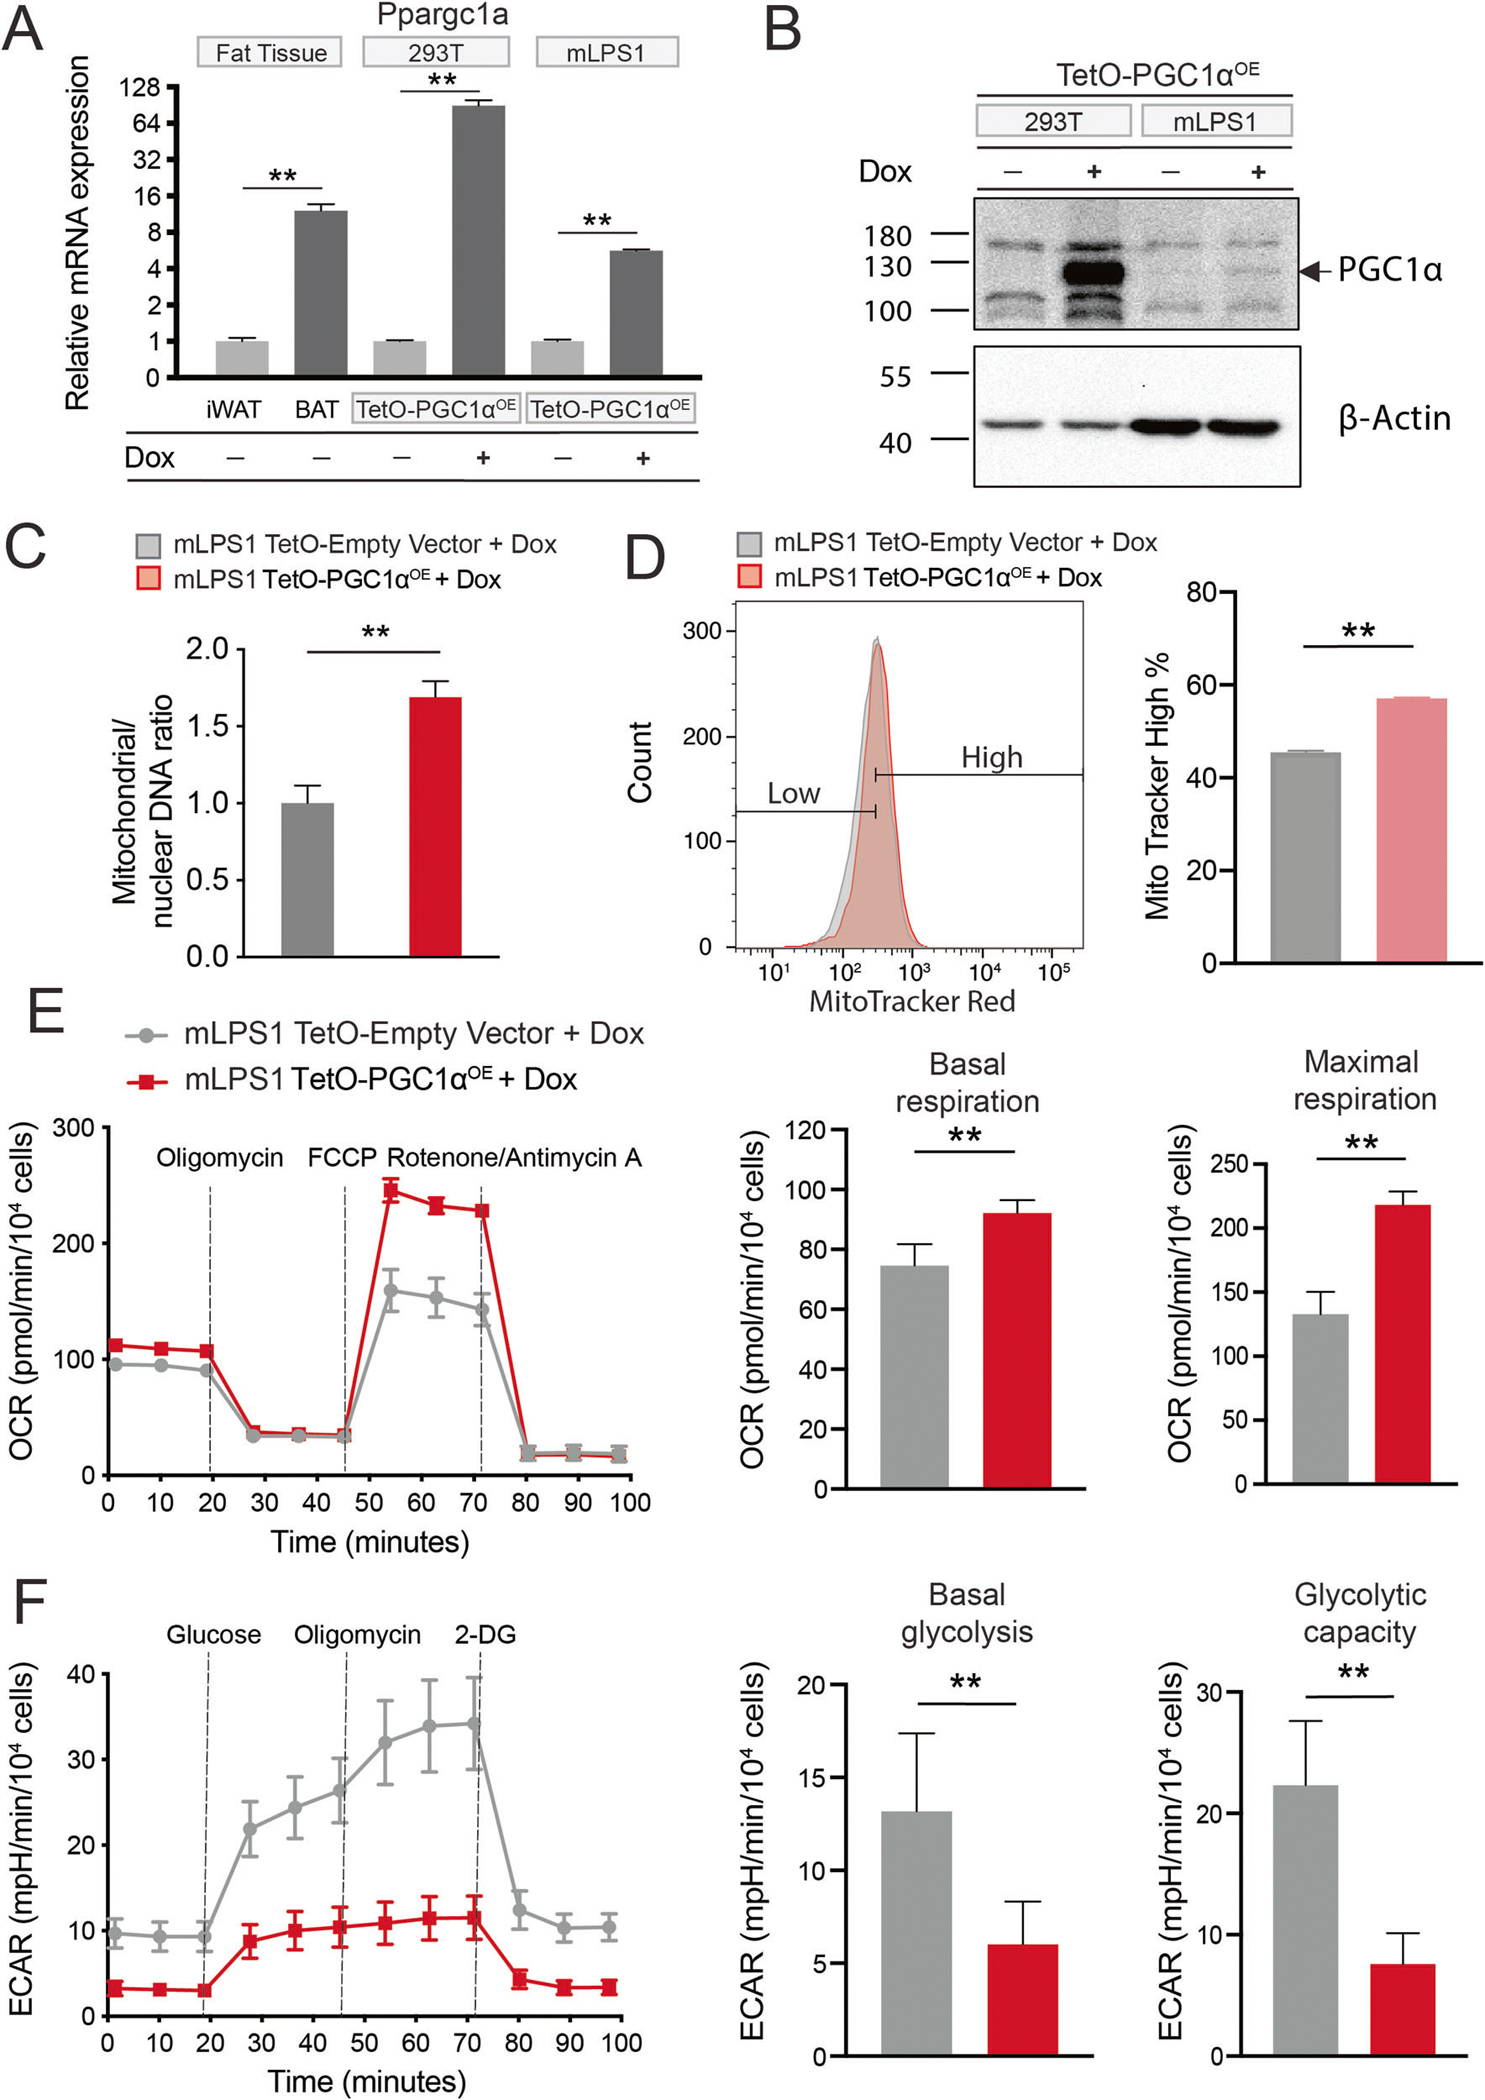
Fig. 7. PGC-1α expression promotes mitochondrial biogenesis and respiration in mLPS1 cells.

A Ppargc1a mRNA levels in mouse inguinal white adipose tissue, brown adipose tissue, TetO-mPGC1αOE stably transfected 293 T cells, and TetO-mPGC1αOE stably transfected mLPS1 cells with or without doxycycline (Dox) induction (n = 3). B PGC-1α protein levels in TetO-mPGC1αOE 293 T and mLPS1 cells treated with or without Dox. C RT-qPCR analysis of mitochondrial DNA (MT-ND1) and nuclear DNA (HK2) in TetO-Empty vector and TetO-mPGC1αOE mLPS1 cells with Dox treatment (n = 3). D TetO-Empty vector and TetO-mPGC1αOE mLPS1 cells were stained with the MitoTracker Red FM probe and analyzed by flow cytometry (n = 3). E The oxygen consumption rate (OCR) was measured with Seahorse in TetO-Empty vector and TetO-mPGC1αOE mLPS1 cells treated with Dox. OCR corresponding to basal mitochondrial respiration (middle) and maximal mitochondrial respiratory capacity (right) were shown (n = 5). F The extracellular acidification rate (ECAR) of TetO-Empty vector and TetO-mPGC1αOE mLPS1 cells treated with Dox. ECAR corresponding to basal glycolysis (middle) and glycolytic capacity (right) were shown (n = 5). Data are presented as mean ± SD of three reading cycles for each cycle, n = 5, *P < 0.05, **P < 0.001.
