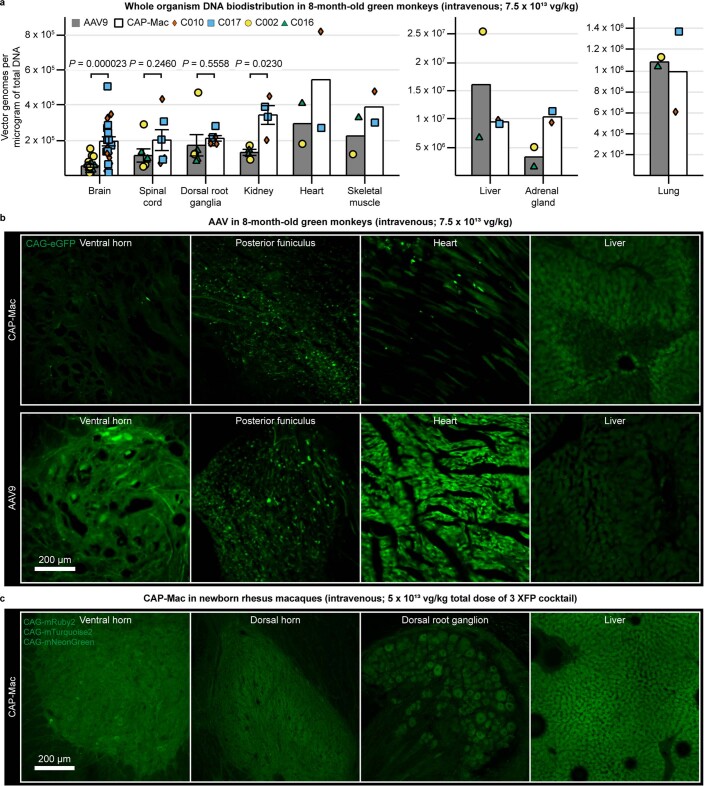
Extended Data Fig. 3. CAG-XFP expression in non-brain tissue of Old World primates treated with AAV.
a, Vector genomes per microgram of total DNA in green monkeys treated with AAV9 (n = 2 green monkeys) or CAP-Mac (n = 2 green monkeys), expressed as fold-change relative to mean AAV9. Each data point represents measured vector genomes per microgram of total DNA in a section of tissue from each region and monkey. Mean ± s.e.m. shown. Two-tailed Welch’s t-test. b, CAG-eGFP expression in the spinal cord, heart, and liver of green monkeys after intravenous expression of either CAP-Mac (top) or AAV9 (bottom). c, CAG-XFP expression in the spinal cord, dorsal root ganglia, and liver of newborn rhesus macaque after intravenous administration of CAP-Mac packaging a cocktail of 3 CAG-XFPs. XFPs are pseudocoloured identically.

