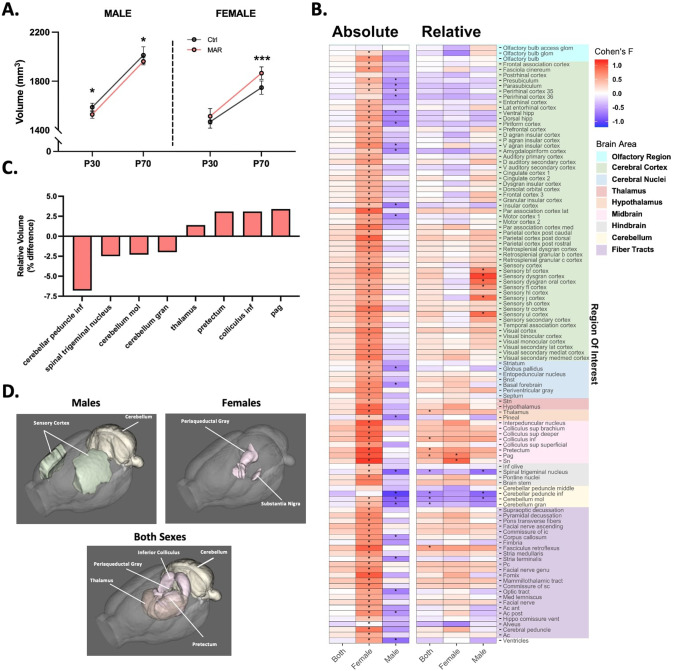
Fig. 4. Altered regional brain volume in MAR-ASD offspring.
A Total brain volume (mm3) in MAR-ASD and Ctrl offspring in both sexes at PND30 and PND70. Data represented as mean ± SD, *p < 0.05, ***p < 0.001. MAR ASD; N = 6/sex, Ctrl; N = 8/sex. B Heatmap plot of absolute and relative regional volumetric differences in MAR-ASD offspring collapsed between time points. Heatmap scale corresponds to Cohen’s F values for the comparisons between MAR-ASD and Ctrl animals for each region. Columns represent data either from both sexes combined (“Both”), or each sex independently. Starred (*) fields represent those comparisons that differed significantly between treatment groups and had a false discovery ratio (FDR) below 5%. Colored blocks on the right y-axis correspond to regional grouping by larger brain areas. Imaging data were analyzed by two-way ANOVA with 5% FDR correction. C Graph of brain regions displaying differences by treatment using relative volumetric analysis. Data expressed as percent change with values collapsed between time point and sex. D Visual representation of brain regions displaying relative volumetric differences in MAR-ASD offspring compared to control animals in males, females, or both sexes combined. Spinal trigeminal nucleus not pictured due to orientation of rendering. Also, subregions within brain area are not broken down (i.e., sensory dysgranular cortex in males) to reduce complexity. All regions are detailed in Supplementary Table 2.

