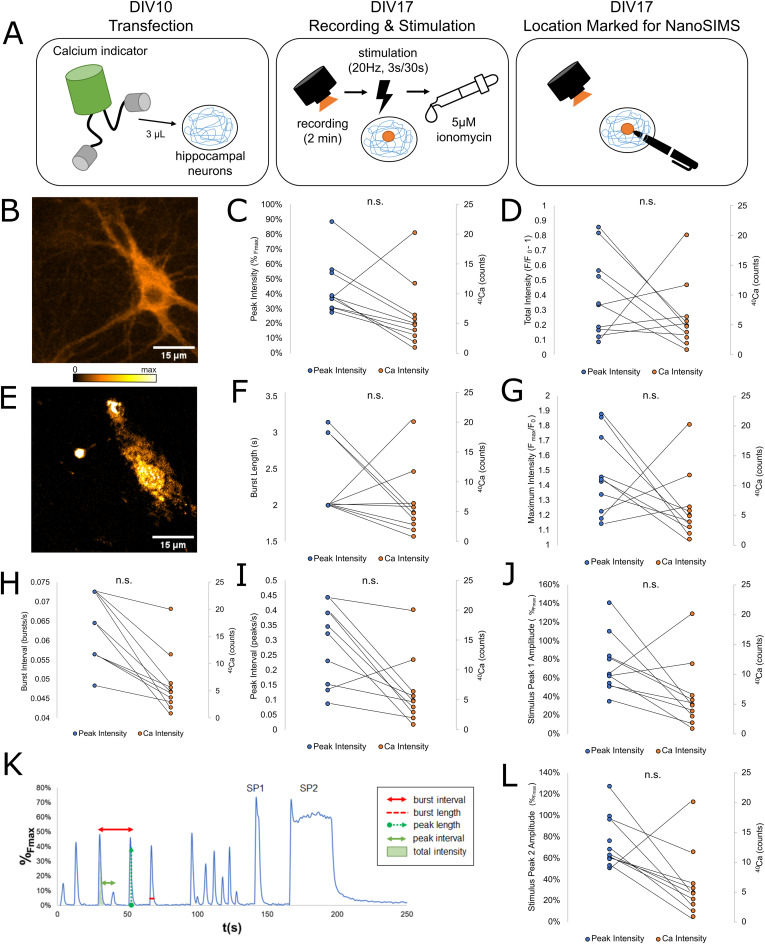
Figure 2. Summary of correlated live imaging and NanoSIMS analyses of free and bound Ca2+.
(A) To observe the free Ca2+ pool, we transfected cultured hippocampal neurons with a genetically encoded Ca2+ indicator (Neuroburst) at DIV10. On DIV 17, we recorded the spontaneous activity of the neurons for 2 min, followed by stimulation at 20 Hz for 3 s, and a second stimulation at 20 Hz for 30 s. After the recording was completed, cells were treated with 400 μl of a 5 µM ionomycin solution in Tyrode buffer and imaged again to obtain Fmax. After this, the location of the observed cell was marked on the coverslip for NanoSIMS analysis, and cells at that location were fixed and embedded. (B, E) Representative images of the same neuron observed using fluorescence microscopy (B) and NanoSIMS (E). (C, D, F, G, H, I, J, L) Ca2+ intensity measured by NanoSIMS was compared to a variety of parameters of Ca2+ activity: Comparison with (C) average peak fl. intensity (%Fmax; N = 10, P = 0.5945) (D) average total fl. intensity (F/F0 – 1; N = 10, P = 0.3132) (F) average burst length (s; N = 10, P = 0.6141) (G) maximum fl. intensity normalized to initial fl. intensity (Fmax/F0; N = 10, P = 0.0991) (H) average burst interval (bursts/s; N = 10, P = 0.1730 (I) average peak interval (peaks/s; N = 10, P = 0.5068) (J) the amplitude of the 3 s stimulus peak (Stimulus Peak 1, %Fmax; N = 10, P = 0.8685), and (L) the amplitude of the 30 s stimulus peak (Stimulus Peak 2, %Fmax; N = 10, P = 0.6547). (K) Representative image of the fluorescence intensity of a single cell during the entire recording period, with the free Ca2+ parameters measured during this experiment labeled. Fluorescence intensities during the recording period were normalized as a percentage between initial intensity (F0) and maximum intensity (Fmax).
Source data are available for this figure.

