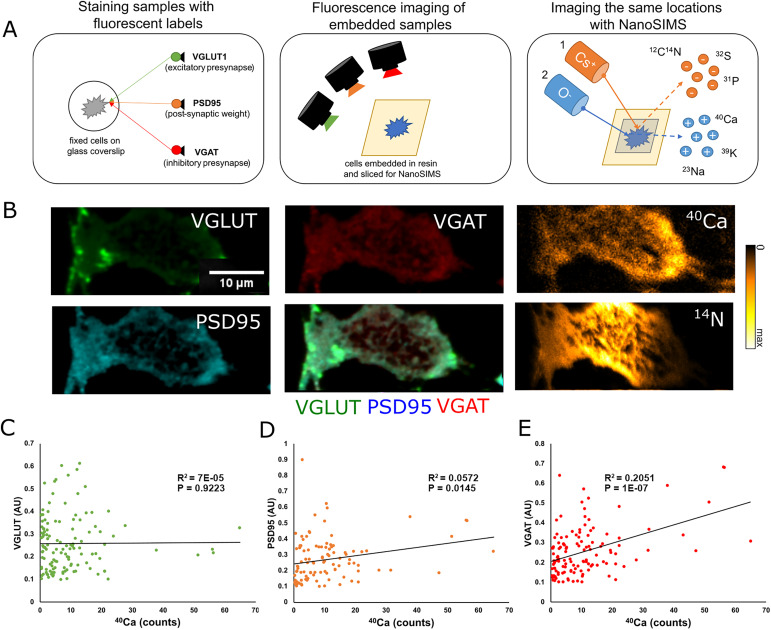
Figure 3. Correlated fluorescence and NanoSIMS measurements of VGAT, VGLUT, and PSD95.
(A) To compare synapse parameters with bound Ca2+, we stained fixed cells for VGLUT in the excitatory pre-synapse, PSD95 as a marker for the post-synaptic density, and VGAT in the inhibitory pre-synapse. Immediately after staining, samples were embedded for NanoSIMS analysis and cut into 200-nm-thin sections. Embedded samples were then imaged using a fluorescence microscope, and the same locations were analyzed using NanoSIMS. (B) Representative images of our three fluorescent parameters (VGLUT, PSD95, and VGAT) with a composite image (middle column, bottom). The images in the rightmost column are the result of NanoSIMS analyses of 40Ca (upper right) and 14N (lower right). Fluorescent images and the 40Ca image are cropped to show the same location as in the 14N image, which has the smallest raster size. (C) Graph comparing the fluorescence intensity of VGLUT to 40Ca counts at selected regions of interest (N = 130, P = 0.9223). (D) Graph comparing the fluorescence intensity of PSD95 to 40Ca counts at selected regions of interest (N = 104, P = 0.0145). (E) Graph comparing the fluorescence intensity of VGAT with 40Ca counts at selected regions of interest (N = 126, P = 1 × 10⁻⁷).
Source data are available for this figure.

