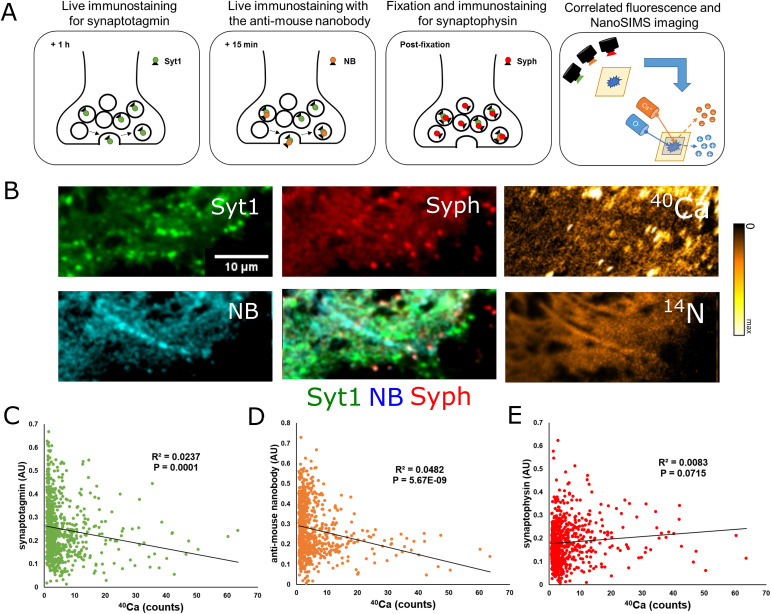
Figure 4. Correlated fluorescence and NanoSIMS measurements of synaptotagmin 1 (Syt1), the anti-mouse nanobody (NB), and synaptophysin (Syph).
(A) To compare synaptic activity with bound Ca2+, we stained live cultured hippocampal neurons with a marker for synaptotagmin 1 for 1 h to label the entire active vesicle pool. After this, we stained the same culture live for 15 min with a secondary nanobody to sample immediate activity. Cells were then fixed and immunostained with Syph to label the entire vesicle pool. Immediately after staining, samples were embedded for NanoSIMS analysis and cut into 200 nm thin sections. Embedded samples were then imaged using a fluorescence microscope, and the same locations were analyzed using NanoSIMS. (B) Representative images of our three fluorescent parameters (Syt1, NB, Syph) with a composite image (middle column, bottom). The images in the rightmost column are the result of NanoSIMS analyses of 40Ca (upper right) and 14N (lower right). Fluorescent images and the 40Ca image are cropped to show the same location as in the 14N image, which has the smallest raster size. (C) Graph comparing the fluorescence intensity of Syt1 to 40Ca counts at selected regions of interest (N = 761, P = 0.0001). (D) Graph comparing the fluorescence intensity of the anti-mouse nanobody to 40Ca counts at selected regions of interest (N = 761, P = 5.67 × 10⁻⁹). (E) Graph comparing the fluorescence intensity of Syph to 40Ca counts at selected regions of interest (N = 761, P = 0.0715).
Source data are available for this figure.

