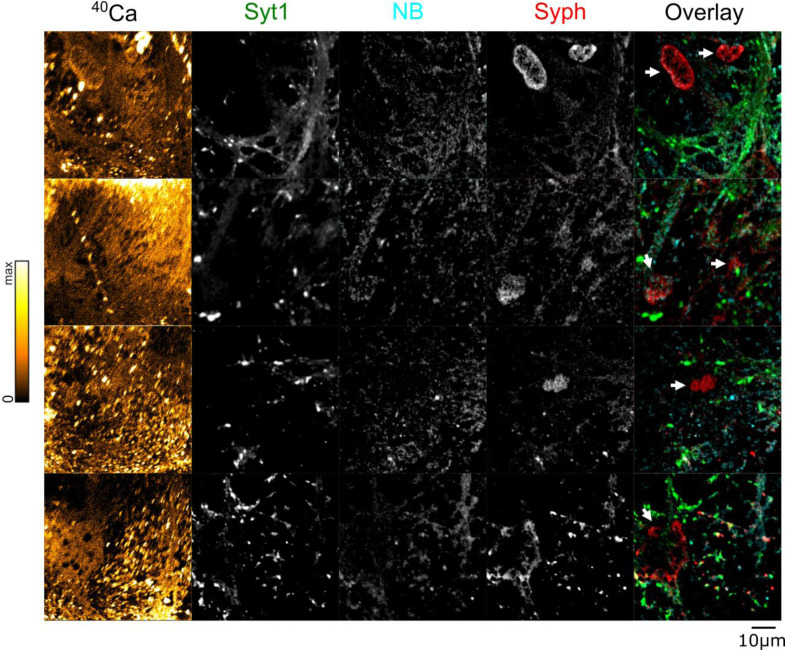
Figure S6. Further correlated NanoSIMS and fluorescent images from plastic-embedded samples labeled with synaptotagmin-1 (Syt1), an anti-mouse nanobody (NB), and synaptophysin (Syph).
40Ca images (leftmost column) were generated using NanoSIMS, which was performed after fluorescence analysis. Brighter colors indicate higher 40Ca intensity. Arrowheads in the overlay figure point to artefacts linked to the strong autofluorescence of the nuclei in the plastic-embedded samples. Such regions were not analyzed. Scale bar: 10 μm.

