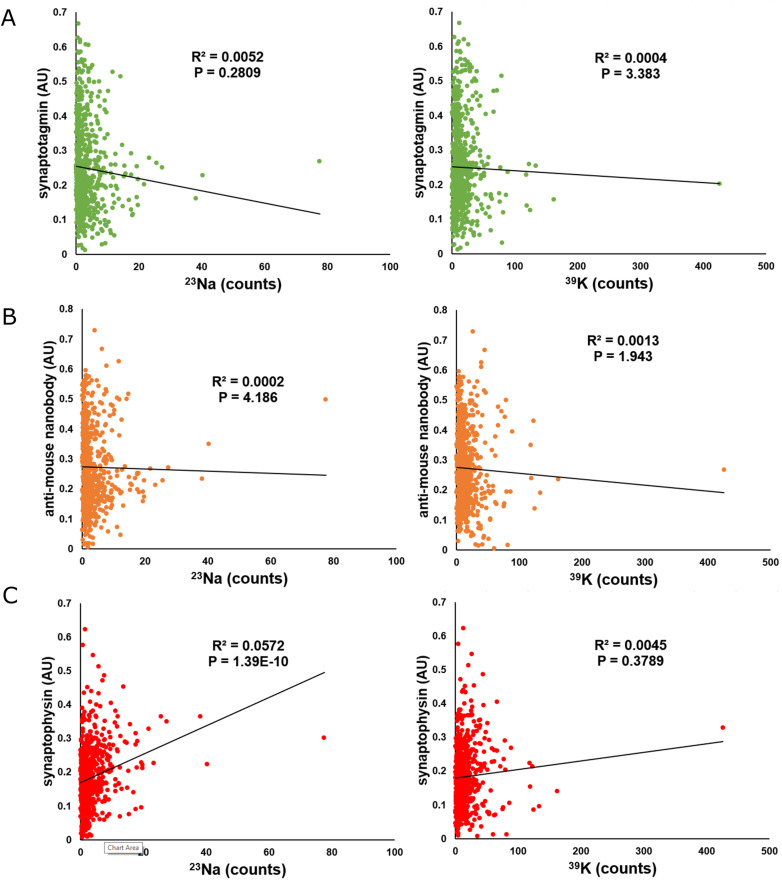
Figure S7. Additional correlated fluorescence and NanoSIMS measurements of synaptotagmin 1 (Syt1), the anti-mouse nanobody (NB), and synaptophysin (Syph).
(A) Graphs comparing the fluorescent intensity of synaptotagmin to 23Na (left, N = 761, P = 0.2809) and 39K (right, N = 761, P = 3.383) counts at selected regions of interest analyzed in this article. (B) Graphs comparing the fluorescent intensity of the anti-mouse nanobody with 23Na (left, N = 761, P = 4.186) and 39K (right, N = 761, P = 1.943) counts at selected regions of interest analyzed in this article. (C) Graphs comparing the fluorescent intensity of synaptophysin with 23Na (left, N = 761, P = 1.39 × 10⁻¹⁰) and 39K (right, N = 761, P = 0.3789) counts at selected regions of interest analyzed in this article.

