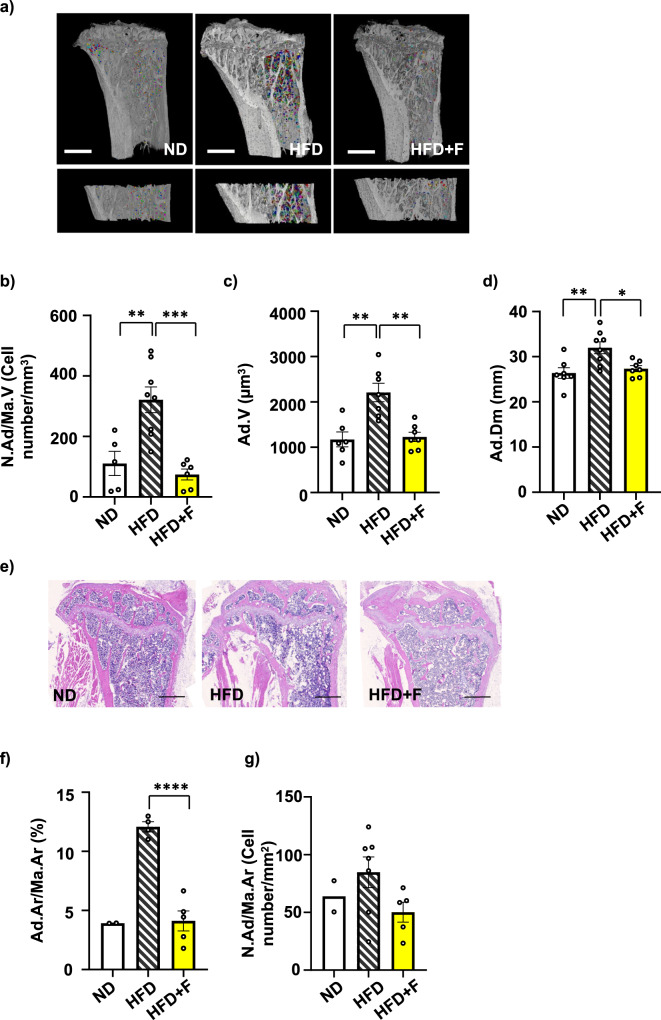
Fig. 2. Omega-3 PUFAs decrease bone marrow adiposity in obese mice.
a Representative pictures of bone marrow adipocytes (BMAds) stained with contrast agent Hexabrix® in the whole proximal tibia and zoomed pictures of BMAds in the selected region of interest in proximal tibia (defined in Material and Methods) of contrast enhanced samples scanned by µCT. Pictures were created using Avizo Software (version 2021.1, ThermoFisher, scale bar 1000 µm). b Quantification of BMAd density (N.Ad/Ma.VCell number/mm3)). c Evaluation of BMAT volume (Ad.V (µm3)) in the selected region of interest in the proximal tibia. (d) Quantitative evaluation of the diameter of Hexabrix-stained BMAds in the tibia (Ad.Dm (mm)). (n = 6-8 per group; one-way ANOVA, Tukey’s multiple comparison test with *p ≤ 0.05, **p ≤ 0.01, ***p ≤ 0.001). Histomorphometric evaluation of the BMAds showing (e) representative pictures from H&E staining of adipocytes from a histological section of the proximal tibia from mice fed with HFD supplemented with omega-3 PUFAs (scale bar 500 µm), (f) total adipocyte area (Ad.Ar/Ma.Ar (%)), and (g) BMAd density affected by omega-3 supplementation in obese mice (N.Ad/Ma.Ar (Cell number/mm2)) (n = 2–7 per group; one-way ANOVA, Tukey’s multiple comparison test with ***p ≤ 0.001, ****p ≤ 0.0001. Data are presented as mean ± SEM (groups coding: white column-ND, black line shading-HFD, yellow column-HFD + F).

