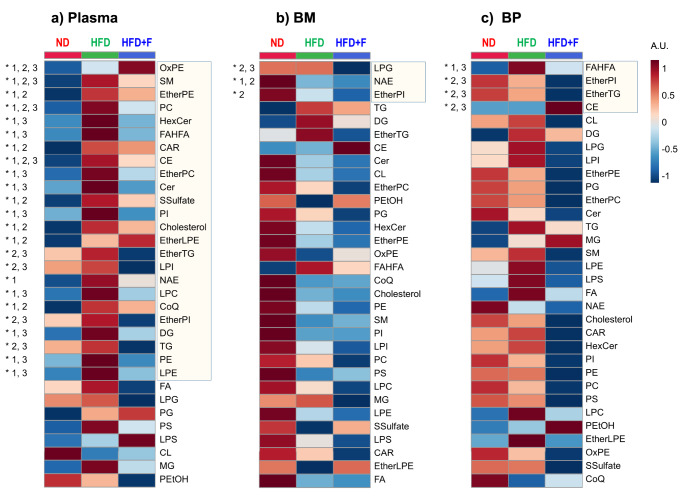
Fig. 3. Lipidomic analysis revealed the effect of omega-3 PUFAs comparing circulating plasma, bone marrow, and bone powder in obese mice.
Global lipidomic profiling of plasma (PL), bone marrow (BM), and bone powder (BP) samples obtained from investigated mice using LC-MS. Heatmap of the sum of the abundances of unique lipid species for each lipid class for (a) plasma, (b) bone marrow, and (c) bone powder with group averages (n = 5-10 per group). Lipid classes statistically altered are marked by an asterisk (*) based on ANOVA with p(FDR) < 0.05. Differences between groups are marked as 1 (ND vs. HFD; p < 0.05), 2 (ND vs. HFD + F; p < 0.05), and 3 (HFD vs. HFD + F; p < 0.05) (gradient color keys used in normalized intensity, A.U.). (Lipid class annotation: CAR acylcarnitine, CE cholesteryl ester, CL cardiolipin, Ce, ceramide, CoQ coenzyme Q, DG diacylglycerol, EtherPE ether-linked phosphatidylethanolamine, EtherLPE ether-linked lysophosphatidylethanolamine, EtherPI ether-linked phosphatidylinositol, EtherPC ether-linked phosphatidylcholine, EtherTG ether-linked triacylglycerol, FA free fatty acid, FAHFA fatty acid ester of hydroxy fatty acid, HexCer hexosylceramide, LPC lysophophatidylcholine, LPE lysophosphatidylethanolamine, LPG lysophosphatidylglycero, LPI lysophosphatidylinositol, LPS lysophosphatidylserine, MG monoacylglycerol, NAE N-acyl ethanolamines, OxPE oxidized phosphatidylethanolamine, PC phosphatidylcholine, PE phosphatidylethanolamine, PEtOH phosphatidylethanol, PG phosphatidylglycerol, PI phosphatidylinositol, PS phosphatidylserine, SM sphingomyelin, SSulfate sterol sulfate, TG triacylglycerol).

