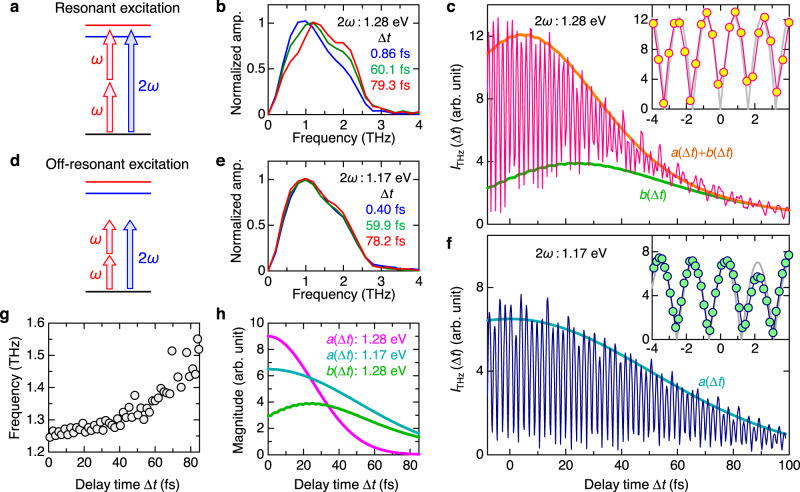
Fig. 5. Spectral features of terahertz radiations by resonant and non-resonant excitation of even-parity and odd-parity excitons in [Ni(chxn)2Br]Br2.
a Schematic diagram of resonant excitation of even- and odd-parity excitons with ω- and 2ω-pulses, respectively. b Typical spectra of electric-field amplitudes of the terahertz radiations for the resonant excitation with 2ℏω = 1.28 eV (ℏω = 0.64 eV). c ∆t dependence of integrated electric-field amplitude of the terahertz radiation, , for the resonant excitation. The orange and green lines show the simulation curves of the envelope, , and the non-oscillating component, , respectively. The gray line in the inset is the simulation curve at ∆t ~ 0 fs. d Schematic diagram of non-resonant excitation. e Typical spectra of electric-field amplitudes of the terahertz radiations for the non-resonant excitation with 2ℏω = 1.17 eV (ℏω = 0.585 eV). f ∆t dependence of for the non-resonant excitation. The blue line shows the simulation curve of the envelope, . The gray line in the inset is the simulation curve at ∆t ~ 0 fs. g ∆t dependence of spectral center of gravity of the electric-field amplitude spectrum. h ∆t dependence of a(∆t) and b(∆t) reflecting the coherent and real exciton responses, respectively.

