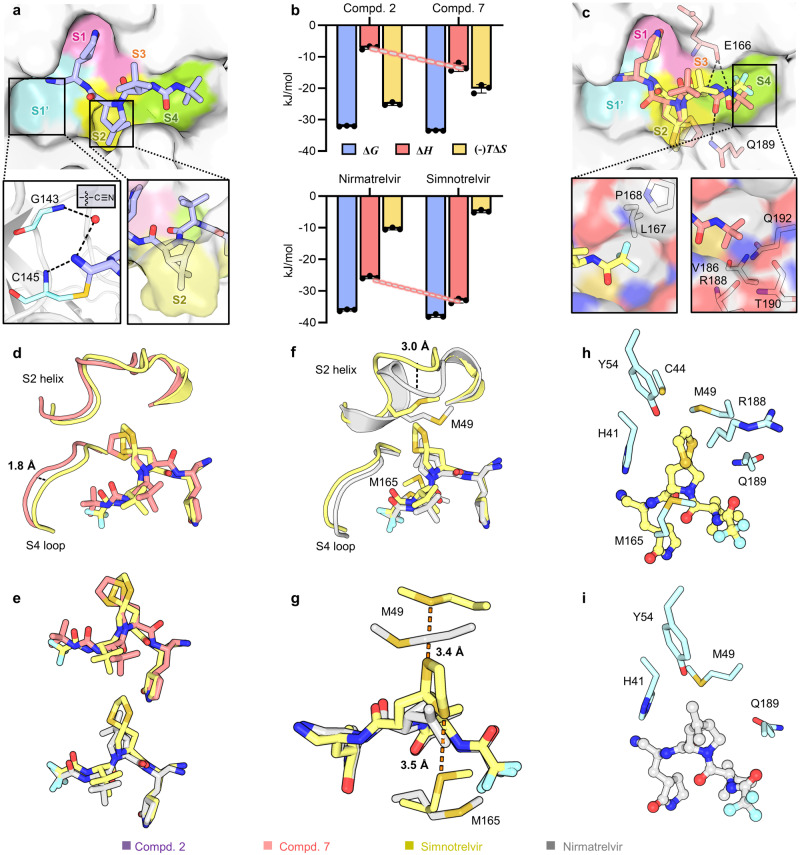
Fig. 2. Crystal structures and thermodynamic profiles of the inhibitors binding to SARS-CoV-2 3CLpro.
a Binding mode of compound 2 (light purple sticks, PDB code: 8IFQ) with SARS-CoV-2 3CLpro. The protease is shown in surface representation. The S1’-S4 subsites are colored as follows: S1’, cyan; S1, magenta; S2, yellow; S3, orange; and S4, green. b Thermodynamic measurements of compounds 2 and 7, nirmatrelvir, and simnotrelvir binding to SARS-CoV-2 3CLpro. The thermodynamic profiles are shown as histograms with the Gibbs free energy of binding (ΔG; light blue), enthalpy (ΔH; salmon) and entropy (−TΔS; light orange). The data are plotted as the mean ± SD from three independent experiments. c–g Comparison of the binding modes of compound 7 (salmon sticks, PDB code: 8IFS), simnotrelvir (yellow sticks, PDB code: 8IGX) and nirmatrelvir (gray sticks, PDB code: 8IGY) with SARS-CoV-2 3CLpro by superimposition of their crystal structures. Residues 40-51 (S2 helix) and 187-192 (S4 loop) of SARS-CoV-2 3CLpro are shown as cartoons. The distances are denoted as dashed lines. h, i Interactions between the P2 segment of simnotrelvir (h) and nirmatrelvir (i) (balls and sticks) and the S2 subsite residues (cyan sticks). Source data are provided as a Source Data file.

