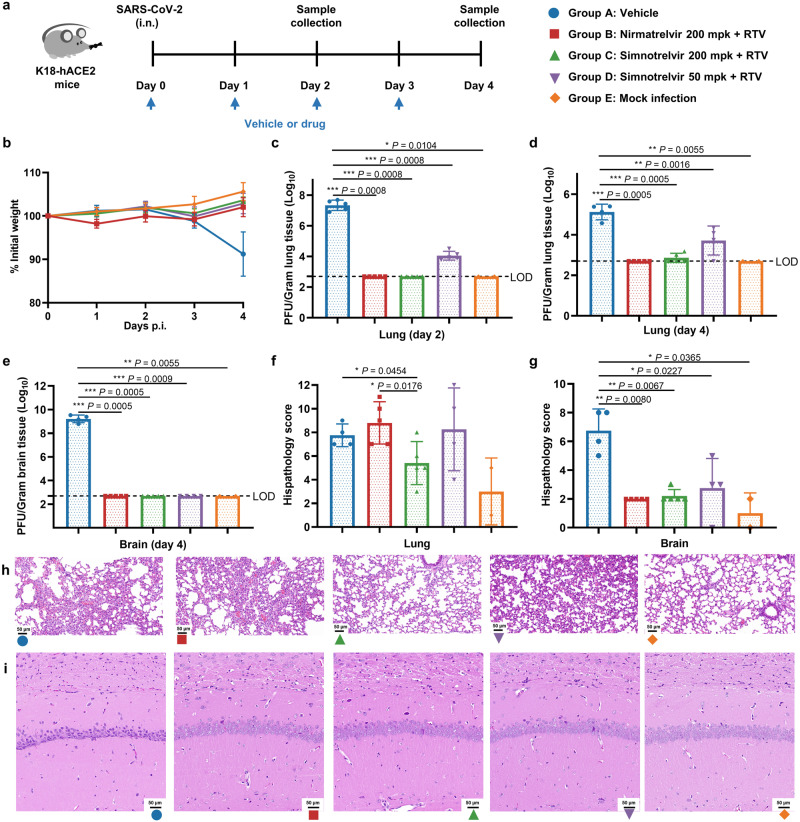
Fig. 4. In vivo oral efficacy of simnotrelvir in K18-hACE2 mice infected with the SARS-CoV-2 Delta strain.
a A flow chart of the K18-hACE2 mice infected with the SARS-CoV-2 Delta strain experiment. K18-hACE2 mice were divided into 5 groups: vehicle (infected control, blue circle, n = 10), nirmatrelvir 200 mg/kg plus ritonavir (RTV) 50 mg/kg (infected, red square, n = 10), simnotrelvir 200 mg/kg plus ritonavir 50 mg/kg (infected, green triangle, n = 10), simnotrelvir 50 mg/kg plus ritonavir 50 mg/kg (infected, purple inversed triangle, n = 10), and mock infection (uninfected control, orange diamond, n = 2). b Changes in mouse body weight were monitored daily (n = 4, 5, 5, 4, and 2 for group A–E). c Viral titers in lungs at Day 2 post-infection (n = 5, 5, 5, 5, and 2 for group A–E). d Viral titers in lungs at Day 4 post-infection (n = 4, 5, 5, 4, and 2 for group A-E). e, Viral titers in brains at Day 4 post-infection (n = 4, 5, 5, 4, and 2 for group A–E). f, g Histopathology scores of lung (f) and brain (g) necrosis and confluent areas of inflammation. h, i H&E-stained sections of lungs (h) and brains (i) at Day 4 post-infection (n = 4, 5, 5, 4, and 2 for group A–E). The scale bars represent 50 μm. LOD indicates the lower limit of detection. The results of body weights and viral titers are graphed as the mean ± SD. Statistical differences were determined by one-way ANOVA in c-e and two-tailed Welch’s t test in (f, g). *P < 0.05, **P < 0.01, ***P < 0.001, ****P < 0.0001. Source data are provided as a Source Data file.

