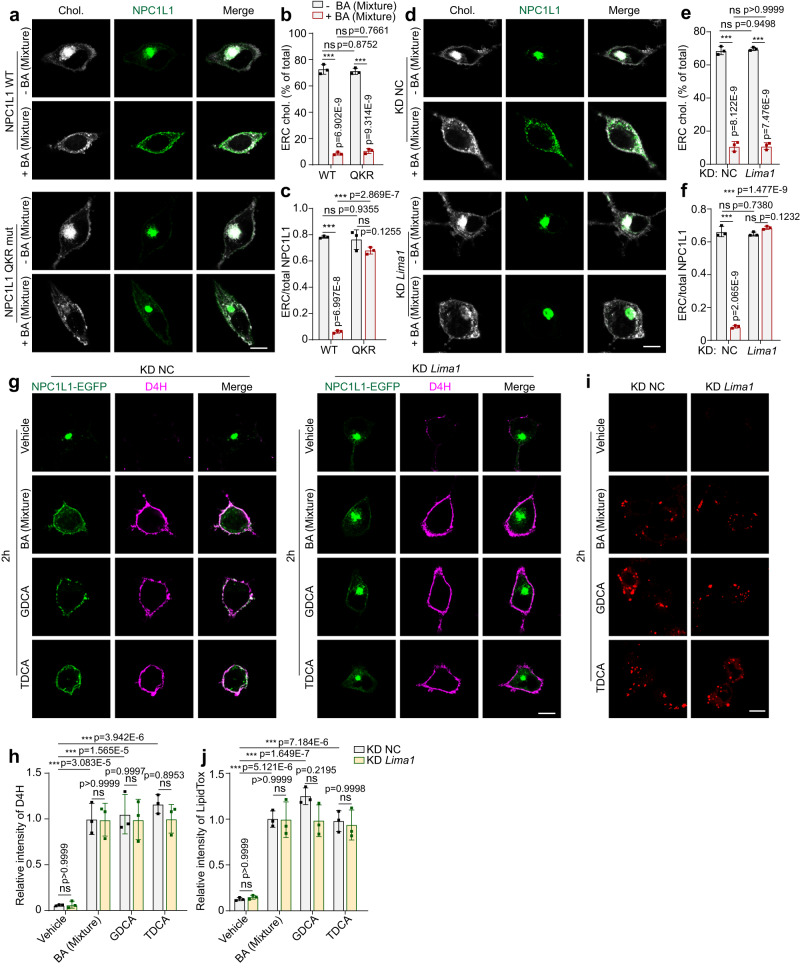
Fig. 5. NPC1L1-LIMA1 interaction is required for NPC1L1 transportation but not cholesterol egress.
a Confocal images of CRL1601 cells transfected with pCMV-NPC1L1-EGFP or Q1277KR → AAA variant (QKR mut) with or without a 2-h treatment of BA mixture. Scale bar, 10 μm. Percentages of ERC cholesterol relative to the total cholesterol (b) and the relative intensity of NPC1L1 resided in ERC (c) in (a) were quantified. Values were presented as mean ± SD (n = 3 independent trials, 100 cells/trial). Two-way ANOVA with Tukey post hoc test, ***P < 0.001; ns, no significance. d Confocal images of control or Lima1 knockdown CRL1601/NPC1L1-3×Myc-EGFP cells with or without a 2-h treatment of BA mixture. Scale bar, 10 μm. Percentages of ERC cholesterol relative to the total cholesterol (e) and the relative intensity of NPC1L1 resided in ERC (f) in (d) were quantified. Values were presented as mean ± SD (n = 3 independent trials, 100 cells/trial). Two-way ANOVA with Tukey post hoc test, ***P < 0.001; ns, no significance. g D4H staining prior to fixation was performed in control or Lima1 knockdown CRL1601/NPC1L1-3×Myc-EGFP cells treated with vehicle, BA mixture, GDCA or TDCA for 2 h. Scale bar, 10 μm. h The relative intensity of D4H in (g) was quantified. The average intensity of D4H in BA mixture-treated control cells was defined as 1. Values were presented as mean ± SD (n = 3 independent trials, 100 cells/trial). Two-way ANOVA with Tukey post hoc test, ***P < 0.001; ns, no significance. i LipidTox staining of control or Lima1 knockdown CRL1601/NPC1L1-3×Myc-EGFP cells after 2-h incubation of vehicle, BA mixture, GDCA or TDCA. Scale bar, 10 μm. j The relative intensity of LipidTox in i was quantified. The average intensity of BA mixture-treated control cells was defined as 1. Values were presented as mean ± SD (n = 3 independent trials, 100 cells/trial). Two-way ANOVA with Tukey post hoc test, ***P < 0.001; ns, no significance. Chol: Cholesterol. Source data are provided as a Source Data file.

