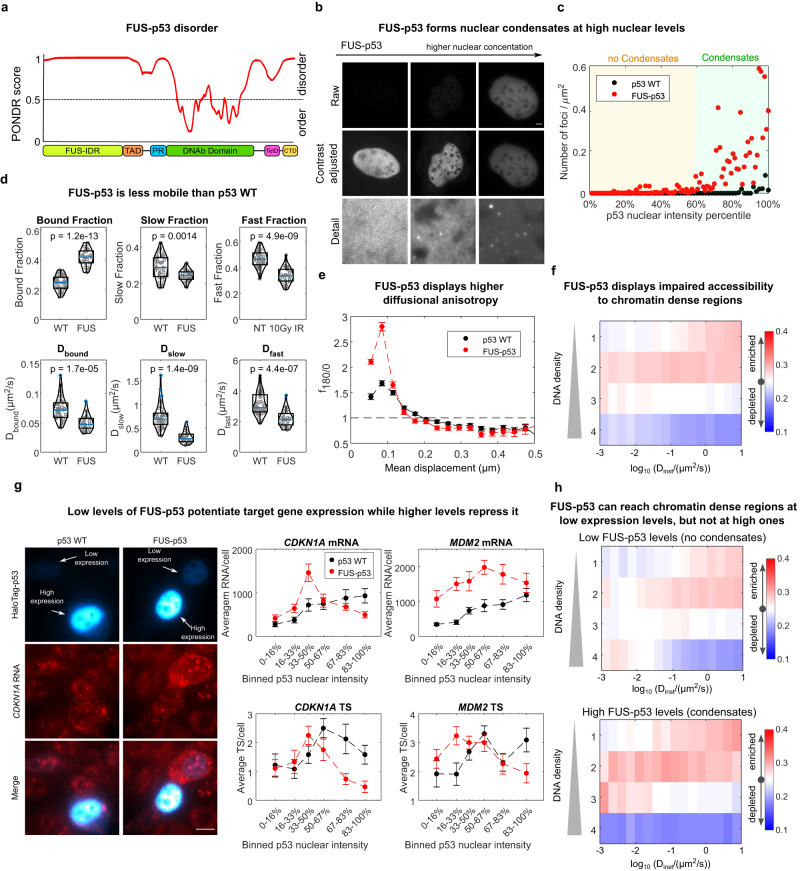
Fig. 6. Fusing an exogenous IDR to p53 renders its diffusion more compact, but interferes with its targeting to DNA-dense regions.
a PONDR analysis of the FUS-p53 construct. b FUS-p53 forms intranuclear condensates above a certain nuclear level that can be estimated c approximately at the 60th percentile of our transfected cell population (ncells = 60, 96 for p53 WT and FUS-p53, experiment repeated on two independent replicates; scale bar: 5 µm). d paSMT shows that FUS-p53 displays a higher fraction of molecules in bound state and slower diffusion coefficients (the blue line represents the median, box edges represent upper and lower quartiles and whiskers extend between Q1−1.5 IQR and Q3 + 1.5 IQR, where IQR is the interquartile range, (ncells = 45, 29 for p53 WT and FUS-p53 respectively, statistical test two-sided Kolmogorov-Smirnov, with Bonferroni correction for multiple testing). e FUS-p53 also displays a more prominent diffusional anisotropy peak (ncells = 45, 29 for p53 WT and FUS-p53 respectively, error bars: s.e.m. estimated by bootstrapping). f SMT/mSIM reveals that FUS-p53 accessibility to DNA-dense regions is impaired. g Simultaneous imaging of HaloTag-p53 nuclear levels and mRNA expression by smFISH (False colors are used in the HaloTag-p53 channels to visualize both low expressing and high expressing cells, scale bar: 5 µm) highlights that p53 target genes are activated in a biphasic manner by FUS-p53. At low nuclear levels, FUS-p53 activates target genes more efficiently than p53 WT, while at higher expression levels FUS-p53 is more repressive (ncells = 65, 102, 77, 93 for WT-CDKN1A, FUS-CDKN1A, WT-MDM2, FUS-MDM2 samples respectively, error bars: s.e.m.). h Stratifying FUS-p53 mSIM/SMT data in cells without and with visible clusters highlights that FUS-p53 binds regions at higher chromatin density when expressed at low levels, with no visible clusters. (ncells = 22,13 for “no-condensate” and “with condensates” datasets respectively). Source data are provided as a Source Data file.

