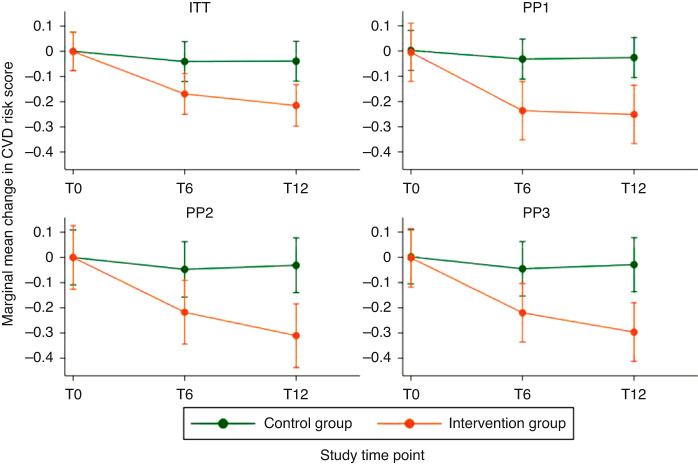
Fig. 2. Marginal mean changes of the CVD risk score (primary outcome) over time and by study group for the intention-to-treat (ITT) and three per protocol (PP) allocations.
This figure shows the marginal mean changes and 95% confidence intervals of the cardiovascular disease (CVD) risk score [z-score, primary outcome] from baseline to 6 and 12 months post-randomisation for the intervention and control group. Estimates from mixed effects generalised linear models adjusted for sex, main diagnostic group and baseline CVD risk score. T0, T6 and T12 denote the study time points: T0 = baseline; T6 = 6 months post-randomisation; T12 = 12 months post-randomisation. The group allocation differed for each of the plots. ITT (intention-to-treat): allocation as randomised (N = 151); PP1 (per protocol analysis 1): control group included participants with <5% increase in maximal power, intervention group included participants with ≥5% increase in maximal power (N = 112); PP2 (per protocol analysis 2): included compliant intervention and control participants only, based on daily self-reported physical activity data with missing days set to 0 activities (N = 82); PP3 (per protocol analysis 3): included compliant intervention and control participants only, based on daily self-reported physical activity data with missing days set to the annual average of activities (N = 87). See Table 3 for the exact point estimates. CVD cardiovascular disease.

