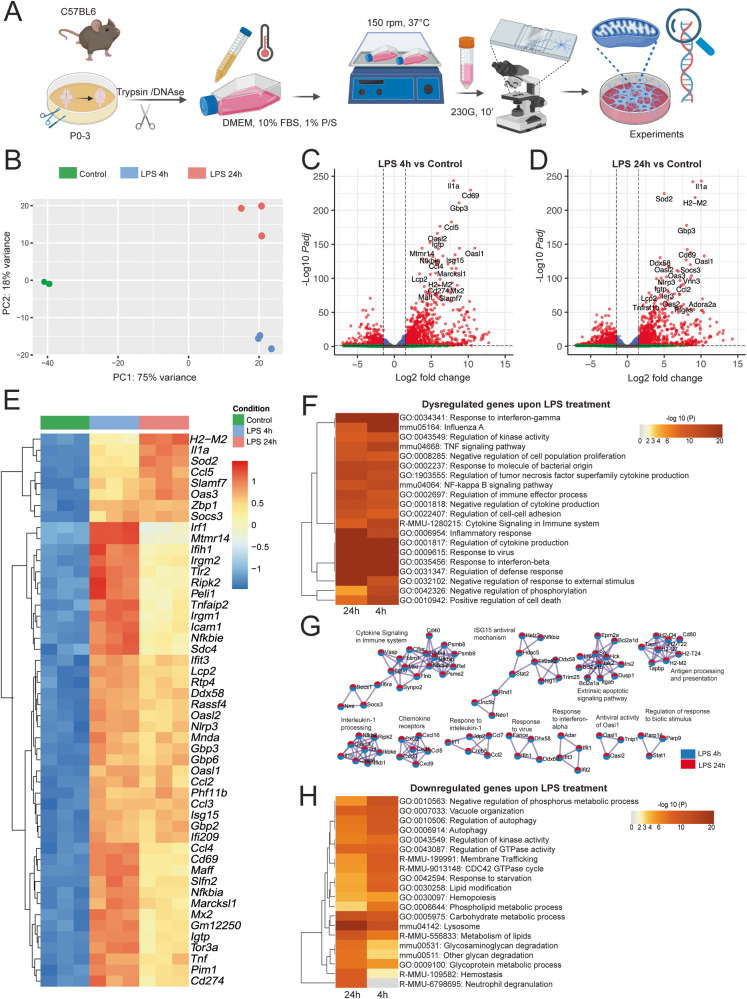
Fig. 1. Transcriptomic analysis of LPS-treated primary mouse microglia.
A Experimental workflow of primary mouse microglia challenge. B Principal Component Analysis (PCA) plot depicting each RNA-seq sample transcriptome, colored by experimental group. Volcano plots depicting fold changes and -Log2 of the adjusted p-value per gene comparing 4 (C) or 24 (D) h LPS treatment and the untreated control (24 h). E Heatmap depicting the top 50 most significant differentially expressed genes of 4 h LPS treatment compared with the control. Color key corresponds to row Z-score. F Gene set enrichment analysis (GSEA) from the DEGs of LPS application of 4 and 24 h, depicted as a hierarchically clustered heatmap. Color key corresponds to the -Log10 of the p-value for enrichment score. G Protein-protein interaction network analysis: proteins from the lists of DEGs of cells challenged with LPS for 4 and 24 h, where Molecular Complex Detection (MCODE) algorithm was applied to identify densely connected network neighborhoods, where such neighborhood component is more likely to be associated with a particular complex or functional unit than the rest of the network. Legend denotes whether the components were found in the DEG lists of either comparison. H GSEA from the downregulated genes in mouse microglia challenged with LPS for 4 and 24 h, depicted as a hierarchically clustered heatmap. Color key corresponds to the -Log10 of the p-value for enrichment score. N = 3 different animals per condition. For all comparisons, p-value was determined by Wald–test with multiple-testing correction by DESEQ2. Figure 1A was made with Biorender.

