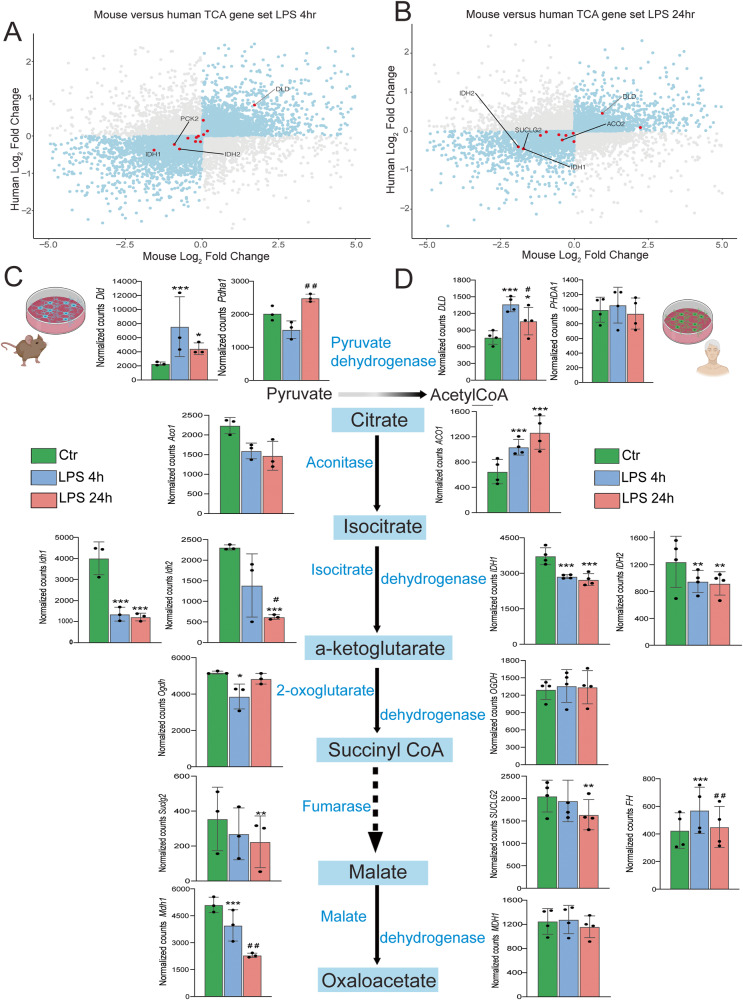
Fig. 6. Transcriptomic comparison of mouse and human TCA cycle genes.
A, B Scatterplots represent the fold changes of LPS stimulation in mouse and human microglia. Dots in blue depict genes that are increased or decreased in both models. In A and B, dots in red represent TCA genes at 4 and 24 h, respectively. Several of the main TCA cycle genes are regulated in mouse (C) and in human (D) microglia. Dotted lines denote intermediate steps in the pathway. Enzymes are depicted in blue font. In (C) and (D) Control is represented in green bars, LPS 4 h is represented in blue bars and LPS 24 h is represented in light red bars. In C: Dld (Ctr vs LPS 4 h: p = 1.11E^-5; Ctr vs LPS 24 h: p = 0.03), Pdha1 (LPS 4 h vs LPS 24 h: p = 0.010), Idh1 (Ctr vs LPS 4 h: p = 1.39E^-7), Idh2 (Ctr vs LPS 24 h: p = 7.82E^-5; LPS 4 h vs LPS 24 h: p = 0.040), Suclg2 (Ctr vs LPS 24 h: p = 0.0071; LPS 4 h vs LPS 24 h: p = 0.015), Mdh1 (Ctr vs LPS 24 h: p = 7.57E^-7; LPS 4 h vs LPS 24 h: p = 0.0025). In D: DLD (Ctr vs LPS 4 h: p = 1.92E-7; Ctr vs LPS 24 h: p = 0.020; LPS 4 h vs LPS 24 h: p = 0.044), ACO1 (Ctr vs LPS 4 h: p = 0.00065; Ctr vs LPS 24 h: p = 1.89E^−6), IDH1 (Ctr vs LPS 4 h: p = 0.00039; Ctr vs LPS 24 h: p = 5.09E^-5), IDH2 (Ctr vs LPS 4 h: p = 0.025; Ctr vs LPS 24 h: p = 0.019) SUCLG2 (Ctr vs LPS 24 h: p = 0.0163), FH (Ctr vs LPS 4 h: p = 0.00038; LPS 4 h vs LPS 24 h: p = 0.0061). Data are presented as mean ± SD. For panel 6C, N = 3 animals per condition. For panel 6D N = 4 independent experiments per condition. For all comparisons, p-value was determined by Wald–test with multiple-testing correction by DESEQ2. *p < 0.05, **p < 0.01, ***p < 0.001 (compared with ctr), #p < 0.05, ##p < 0.01 (LPS 4 h vs LPS 24 h). Figure 6C and D were made with Biorender.

