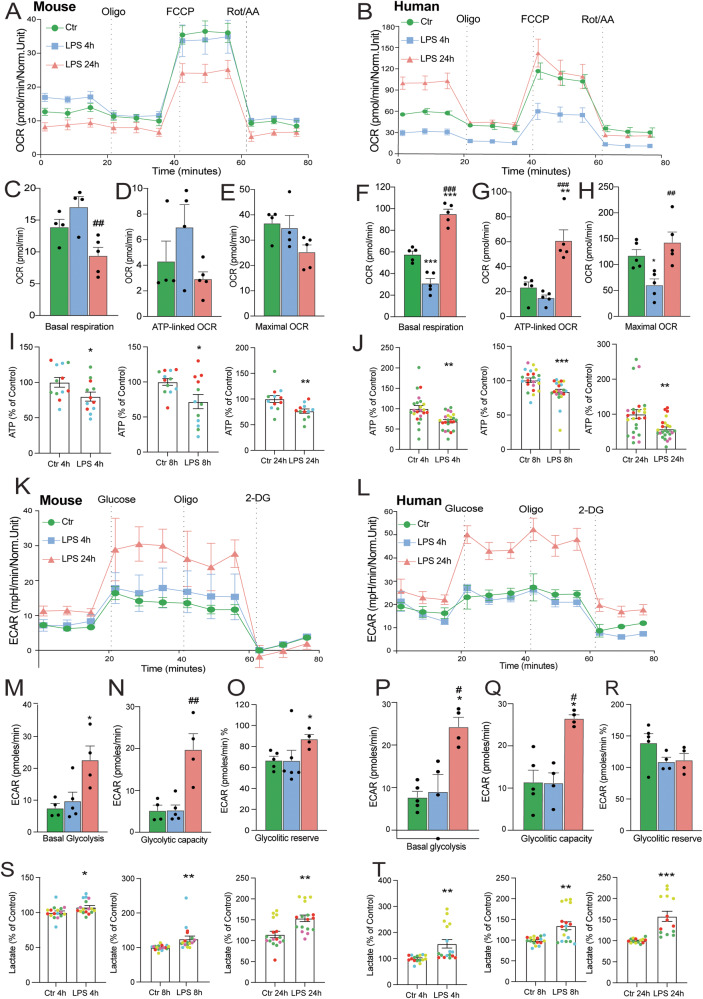
Fig. 7. Mitochondrial respiration analysis of mouse and human microglia.
Representative experiments showing OCR (oxygen consumption rate) in mouse (A) and human (B) microglial cells treated with LPS for 4 h and 24 h. For panels A, C–E: N = 4 Control and LPS 4 h; N = 5 LPS 24 h technical replicates of a representative experiment that was repeated 4 times with similar results. C–H Bar graph showing different mitochondrial respiration parameters represented as mean ± SEM of the OCR values in mouse (C–E) (in (C), LPS 4 h vs LPS 24 h, p = 0.006) and human (F–H). For panels B, F–H: N = 5 Control, LPS4h and LPS 24 h technical replicates of a representative experiment that was repeated 4 times with similar results. (In (F), Ctr vs LPS 4 h, p = 0.001, Ctrl vs LPS 24 h, p = 4.74E^-5, LPS 4 h vs LPS 24 h, p = 1.66E^−7; in (G), Ctr vs LPS 24 h, p = 0.0015, LPS 4 h vs LPS 24 h, p = 0.0003; in (H), Ctr vs LPS 4 h, p = 0.044, LPS 4 h vs LPS 24 h, p = 0.005). ATP measurements of LPS-treated mouse microglia (I) or human iMGLs (J) for several timepoints colored by experiment. For (I) N = 12 technical replicates across 4 experiments (LPS 4 h, p = 0.042, LPS 8 h, p = 0.02, LPS 24 h, p = 0.0068) and for (J) N = 23 Ctr 4 h, LPS 4 h, N = 22 Ctr 8 h, LPS 8 h, N = 23 Ctr 24 h and LPS 24 h technical replicates across 4 experiments (LPS 4 h, p = 0.001, LPS 8 h, p = 0.0009, LPS 24 h vs Ctrl 24 h, p = 0.0047). K, L Representative experiments depicting extracellular acidification rates (ECAR) in mouse and human microglia cells treated with LPS for 4 h and 24 h. For panels K, M–O: N = 4 Control; N = 5 LPS 4 h; N = 4 LPS 24 h technical replicates of a representative experiment that was repeated 4 times with similar results. Bar graphs showing different acidification parameters represented as mean ± SEM of the ECAR values in mouse (in (M), Ctr vs LPS 24 h, p = 0.018, LPS 4 h vs LPS 24 h, p = 0.032; in (N), Ctr vs LPS 24 h, p = 0.0036, LPS 4 h vs LPS 24 h, p = 0.0026; in (O), Ctrl vs LPS 24 h, p = 0.042) and in human (in (P), Ctr vs LPS 24 h, p = 0.0027, LPS 4 h and LPS 24 h, p = 0.0067, in (Q), Ctr vs LPS 24 h, p = 0.0024, LPS 4 h vs LPS 24 h, p = 0.0032). For panels L, P–R: N = 5 Control; N = 4 LPS 4 h and LPS 24 h technical replicates of a representative experiment that was repeated 4 times with similar results. Lactate measurements of the supernatants of mouse microglia (S) and human iMGLs (T) treated with LPS for 4, 8 and 24 h expressed as a percentage of the untreated control for the same timepoint colored by experiment. Data are shown as mean ± SEM. For (S) N = 17 technical replicates across 4 experiments. For (T) N = 16 Ctr 4 h, N = 17 LPS 4 h, Ctr 8 h, LPS 8 h, N = 14 Ctr 24 h, LPS 24 h. (LPS 4 h, p = 0.003, LPS 8 h, p = 0.001, LPS 24 h, p = 0.0003). p-value was determined by one-way ANOVA for OCR and ECAR, and unpaired two-tailed t-test for ATP and lactate. *p < 0.05, **p < 0.01, ***p < 0.0001 (compared with ctr), #p < 0.05, ##p < 0.01(LPS 4 h vs LPS 24 h).

