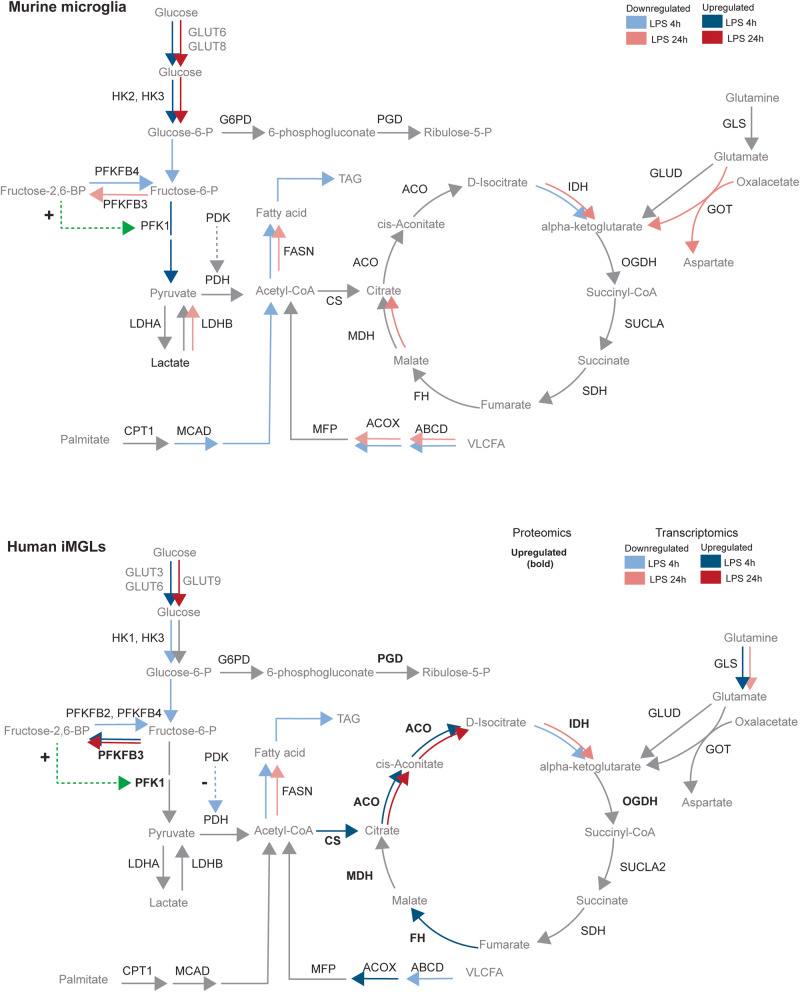
Fig. 8. Similarities and divergences in mouse and human microglial metabolism.
Upper panel: Upon LPS treatment mouse microglia upregulate genes that code for glucose transporters GLUT6 and GLUT8, HK2 and HK3 robustly at 4 h and 24 h with a shared decrease of downstream pathway components and downregulation of isocitrate dehydrogenase. A sustained downregulation of genes that encode key fatty acid import mediators, such as ATP-binding cassette transporter subfamily D (ABCD) and peroxisomal acyl-coenzyme A oxidase (ACOX) is concomitant with a downregulation of fatty acid synthesis key enzyme fatty acid synthase (FASN). Lower panel: Upon LPS treatment human iMGL cells robustly upregulate genes that code for glucose transporters GLUT3 and GLUT6 at 4 h, and GLUT9 at 24 h. Human iMGLs only upregulate hexokinases 1 and 3 at 4 h, not at 24 h. Downstream elements of the glycolytic pathway such as PFKFB3 are upregulated. An increase in Fructose-2,6 biphosphate promotes PFK1 activity. In our analyses, the upregulation of GLS only occurred at 4 h in human iMGLs and not in mouse microglia. Within the TCA cycle, citrate synthase (CS) and aconitase (ACO) were upregulated both at 4 h and 24 h, while isocitrate dehydrogenases (IDH1 and IDH2) were downregulated both at 4 h and 24 h. Downregulation of genes that encode fatty acid import and catabolism, such as ABCD and ACOX occurs concomitantly with a sustained downregulation of FASN upon LPS. Grey lines denote unchanged gene expression. Dotted green lines denote promotion of enzyme activity. Dotted blue lines denote negative feedback on enzyme activity. Dark-colored arrows denote upregulation of gene expression at 4 h (blue) and 24 h (red). Light-colored arrows denote downregulation of gene expression at 4 h (blue) and 24 h (red). Upregulation of protein abundance is denoted in bold letters. Data that supports this figure is found in Supplementary material.

