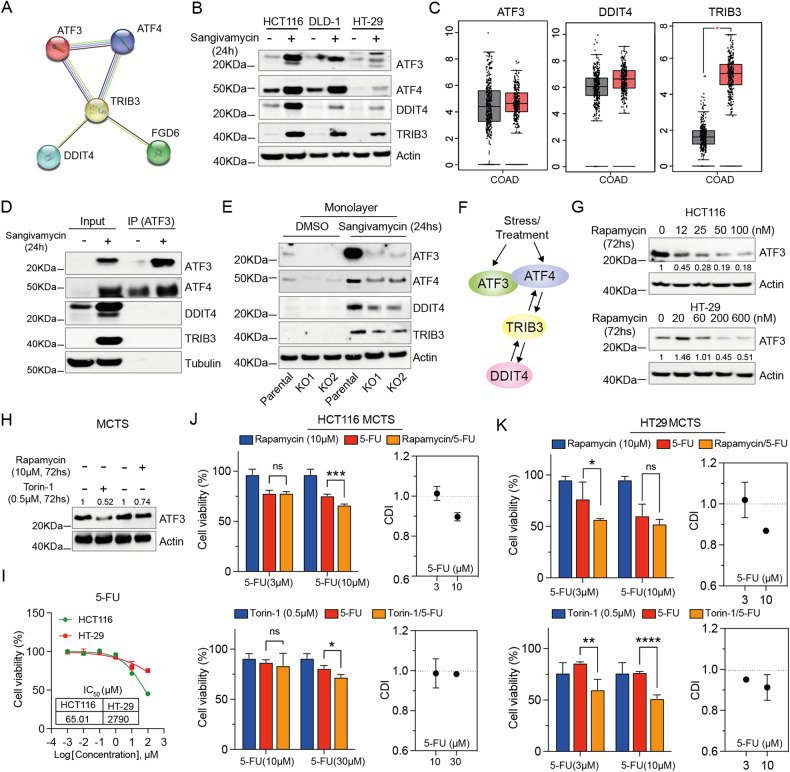
Fig. 6. Lowering ATF3 improves the effect of 5-FU on CRC MCTS.
A Plot for protein interactions among genes ATF3, ATF4, DDIT4, TRIB3 and FGD6 by the STRING interaction network. B Expression levels of ATF3, ATF4, DDIT4 and TRIB3 in HCT116, DLD-1 and HT-29 cells treated with DMSO or 100 nM sangivamycin for 24 h under monolayer conditions. Actin is the loading control. C Expression levels of ATF3, DDIT4 and TRIB3 were assessed in COAD tissues and normal adjacent tissues using RNA-Seq data from TCGA (* p < 0.05). Cohort size: (num)normal adjacent tissues = 349; (num) COAD tissues = 275. D Western blot analysis of the co-IP complex from cells treated with DMSO or 100 nM sangivamycin for 24 h with ATF3 antibody immobilized on Dynabeads®. Tubulin is the loading control for the input conditions. E Expression levels of ATF3, ATF4, DDIT4 and TRIB3 in HCT116 ATF3parental and ATF3KO cells treated with DMSO or 100 nM sangivamycin for 24 h under monolayer conditions. Actin is the loading control. F Illustration of the interaction between ATF3, ATF4, DDIT4 and TRIB3 based on our results and findings from other groups [79–81]. G ATF3 expression levels in HCT116 and HT-29 cells treated with the indicated concentrations of rapamycin for 72 h under monolayer conditions. Actin is the loading control. H ATF3 expression levels in HCT116 MCTS cells treated with rapamycin (10 µM) or Torin-1 (0.5 µM) for 72 h. Actin is the loading control. I Dose response of HCT116 and HT29 MCTS to 5-FU. The data is expressed as the mean ± SD (n = 3). The half-maximal inhibitory concentration (IC50) was calculated using nonlinear regression, [Inhibitor] vs. normalized response analysis. J Combination of rapamycin (10 µM) or Troin1(0.5 µM) with 5-FU under HCT116 MCTS conditions for 72 h. The data is expressed as the mean ± SD (n = 3, unpaired t-test, two-stage step-up (Benjamini, Krieger, and Yekutieli); * p < 0.05, *** p < 0.001). K Combination of rapamycin (10 µM) or Troin1(0.5 µM) with 5-FU under HT29 MCTS conditions for 72 h. CDI = AB/(A × B) where: AB = cell viability value for the combination of rapamycin/torin-1 and 5-FU. A and B = cell viability value for the single treatment rapamycin/torin-1 or 5-FU. A CDI value <1, =1 or >1 indicates that the drugs are synergistic, additive, or antagonistic, respectively. A CDI value less than 0.7 indicates a significant synergetic effect [31].

