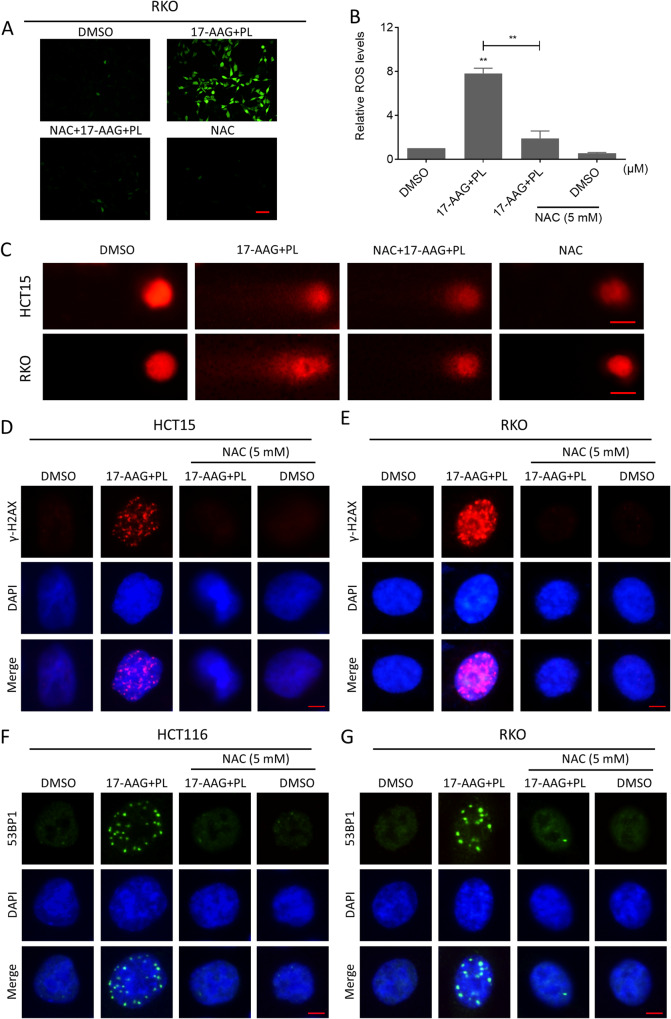
Fig. 3. ROS scavenger reversed the efficacy of the combination treatment.
A, B Intracellular ROS levels in RKO cells treated with the combination of 17-AAG and PL for 2 h following pretreatment with NAC (5 mM) for 1 h (**p < 0.01). Scale bar = 75 µm. C Representative images of cell trailing in a comet assay. Scale bar = 10 µm. D, E Representative images showing nuclear foci formation of γ-H2AX in HCT15 or RKO cells treated with the combination of 17-AAG and PL following pretreatment with NAC (5 mM) for 1 h. Scale bar = 5 µm. F, G Representative images showing nuclear foci formation of 53BPl in HCT116 or RKO cells treated with the combination of 17-AAG and PL following pretreatment with NAC (5 mM) for 1 h. Scale bar = 5 µm.

