Fig. 2.
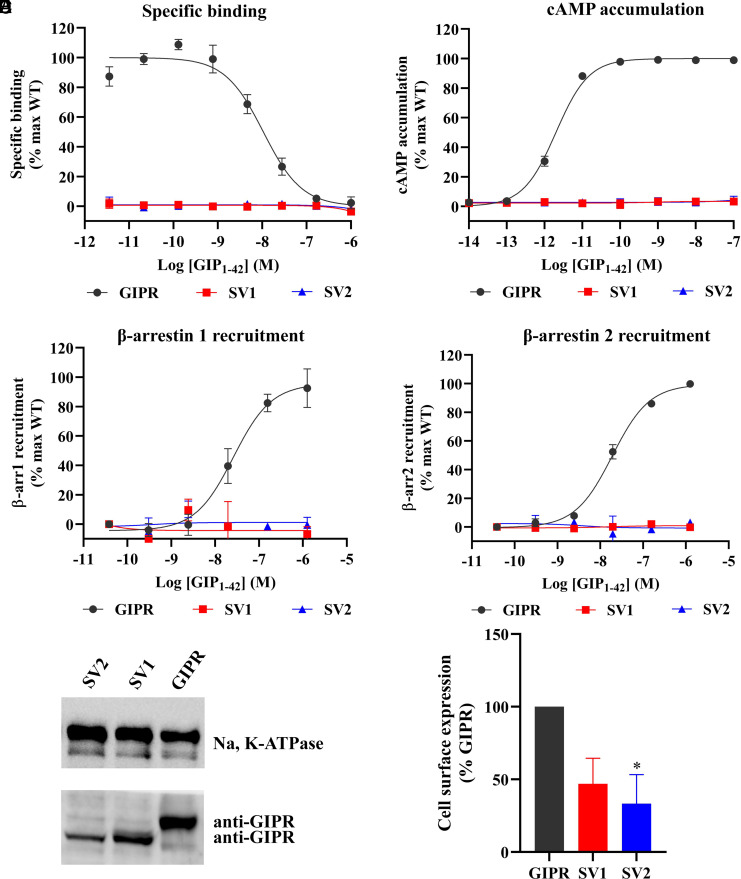
Ligand-binding, signaling profiles and cell surface expression of GIPR and its SVs. (A) Competitive inhibition of 125I-GIP1-42 binding to GIPR and SVs by unlabeled GIP1-42. Binding affinity is quantified by reduction of radioactivity (counts per minute, CPM). (B) Concentration–response curves of cAMP accumulation elicited by GIP1-42 at GIPR and SVs. (C and D) β-arrestins 1 (β-arr1) and 2 (β-arr2) recruitment by GIPR and SVs. Concentration–response characteristics are shown as the area-under-the-curve (AUC) across the time course–response curve (0 to 10 min) for each concentration. Data shown are means ± SEM of at least three independent experiments (n = 3 to 5) performed in quadruplicate (cAMP accumulation) or duplicate (specific binding and β-arrestin recruitment). Signals were normalized to the maximum (max) response of the WT GIPR, and concentration–response curves were analyzed using a three-parameter logistic equation. (E) Cell surface expression of GIPR and each SV by western blot using antibodies against GIPR and Na, K-ATPase (internal reference), Left panel. The Right panel shows the quantification. Data shown are means ± SEM of three independent experiments (n = 3). One-way ANOVA was used to determine statistical difference (*P < 0.05).

