Fig. 4.
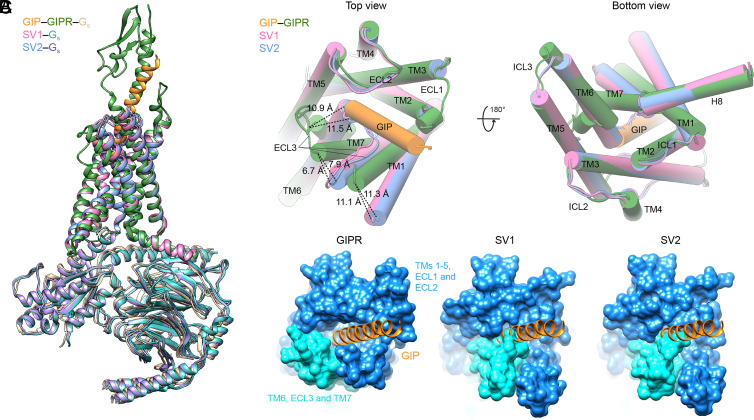
Structural comparison of GIPR, SV1, and SV2. (A) Structural comparison of GIP–GIPR–Gs (PDB code: 7DTY), SV1–Gs, and SV2–Gs. The structures of SV1 and SV2 are superimposed on the GIP-bound GIPR using the Cα carbons of the TMD residues. (B) Extracellular view (Left) and intracellular view (Right) of the receptor TMD. The ECD of GIPR and all the G proteins are omitted for clarity. The receptors and peptides are colored as labeled. (C) Surface representation of the TMD peptide-binding pocket among GIPR, SV1, and SV2 structures. The GIP is shown in orange, the N-terminal half of TMD (TMs 1-5, ECL1, and ECL2) in dodger blue, and the C-terminal half of TMD (TM5, ECL3, and TM6) in cyan.

